

Perritt Clips
What are Microcap Stocks?
Wall Street Journal – June 2015
You can read recent press coverage of The Perritt Low Priced Stock Fund in the Wall Street Journal by clicking here.
Please click here for standardized performance.
Performance data quoted represents past performance; past performance does not guarantee future results. The investment return and principal value of an investment will fluctuate so that an investor’s shares, when redeemed, may be worth more or less than their original cost. Current performance of the fund may be lower or higher than the performance quoted. Performance data current to the most recent month end may be obtained by calling 1-800-331-8936.
Reuters – April 2015
As strong dollar weighs, not all small US stocks are beautiful
While in the author’s opinion not all small companies may thrive during a strong dollar environment, portfolio Manager Michael Corbett provides examples of companies whose businesses may included inherent hedges from currency fluctuations. For much more of our own insight regarding trends in the dollar, see our research paper Dollar Strength and Small-Cap Stock Returns.
Click here to read the full article
Raymond James – April 2015
“Size matters not, said Jedi Master Yoda”
Raymond James Chief Investment Strategist Jeffrey Saut cites Michael Corbett’s 1st Quarter Manager Commentary at length in his investment strategy note “Size Wars.” Mr. Saut agrees with our analysis of the small/micro-cap universe beginning to outperform its large cap peers (Small/micro-caps represented by the Russell 2000 Index, and large caps represented by The S&P 500 Index, as of 3/31/15). In his opinion, “the micro-cap space is where there are a lot of mispriced stocks…. And there is little (if any) research coverage.”
To view the Raymond James Morning Tack Report, click here.
Manager Commentary, 1st Quarter 2015
Size Wars: Return of the Small-Cap
“Size Matters Not,” said Jedi Master Yoda. Obviously, he never had to sit with a client comparing their portfolio to the S&P 500 Index. Jedi or not, as you know too well large-cap US companies were one of the best U.S. investments in 2014. In fact, large-cap stocks as measured by the S&P 500 Index returned 8.8% more than small caps as measured by the Russell 2000 Index in 2014, the best annual relative return for large-cap (as measured by the S&P 500 Index) vs. small-cap (as measured by the Russell 2000 Index) since 1998. But a curious trend developed at the end of 2014 and has continued through the first quarter of this year: the return of small company stocks.
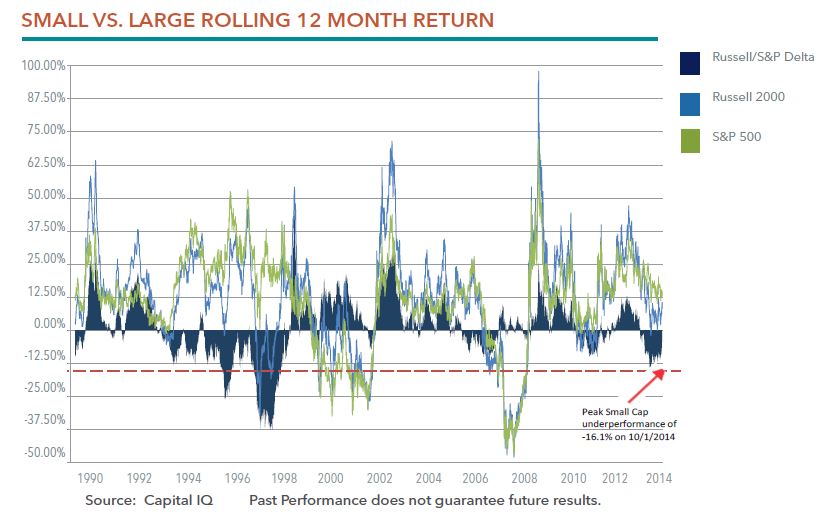
The chart below shows the 12-month rolling return difference between the S&P 500 Index and the Russell 2000 Index. As you can see, large-caps reached a peak level of outperformance vs. small-caps on October 1 of last year, at 16.1%. This was almost exactly at the average peak outperformance we have seen over the past twenty-four years. Perhaps not surprisingly, since October 2014 small-cap companies have begun to outperform the S&P 500 Index.
Following such strong returns in 2013, we were hesitant to make any bold predictions about future small-cap performance last year. Today, when we look at what seems to be a budding trend of small cap outperformance, we feel more confident. Here are four reasons why the recent trend of small-cap outperformance may be just the beginning: a strong dollar, higher earnings growth, abundance of quality companies, and potential earnings power.
Strong dollar is a positive for small-caps
As we explored in our research paper Dollar Strength and Small Cap Stock Returns, historically a strong dollar has been better suited for small-cap stocks than large-caps. A strong dollar hurts multi-national corporations as foreign buyers see U.S. goods as more expensive compared to non-U.S. goods. Since smaller companies rely more on domestic revenue, small-caps can thrive under these circumstances. We believe any ongoing trend of dollar strength should continue to propel small-cap relative returns.
Higher earnings growth at lower multiples
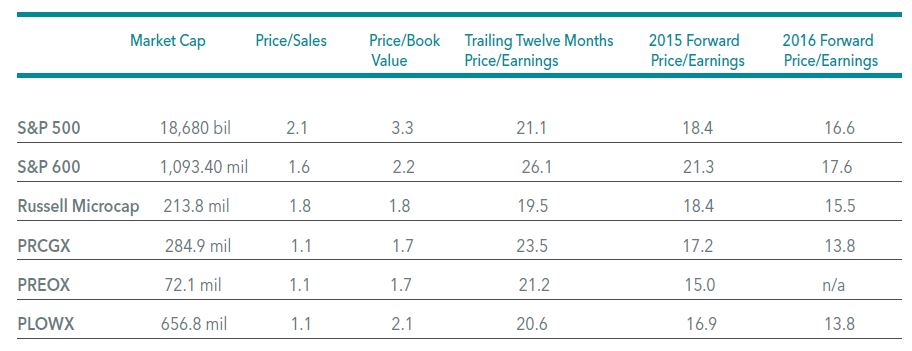
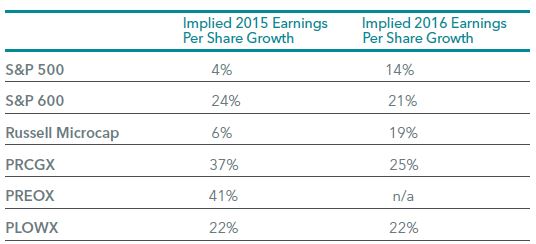
Where can investors find growth? The earnings growth forecast by large-cap companies has largely disappeared after several years of strong performance. As seen in the table below, the Earnings per share (EPS) growth forecasts for small companies is 24% for 2015, as compared to just 4% for S&P 500 companies. In fact, quality small companies which have been largely ignored by the market are providing investors with the highest earnings growth potential and at modest multiples.
As of 3/31/15
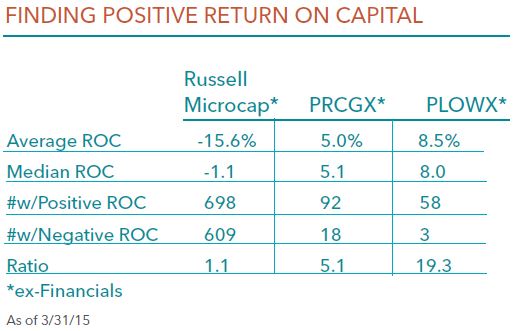
Quality companies and return on capital
With many thousands of companies to choose from, small- and micro-cap investors potentially have an advantage because they can build a portfolio that bears little resemblance to the benchmark. In our opinion, the current environment presents significant opportunities for bottom-up investors who focus on quality companies. Quality, as measured by return on capital (ROC), is in short supply if you are stuck in the micro-cap index. For an active manager, however, focused opportunities are abundant. As seen in the table below, the ratio of companies creating a positive return on capital versus those losing money is five-times greater in PRCGX than in the broader micro/small-cap market.
Case Studies: Outlook for Earnings Power on the Horizon
You can’t have strong small-cap relative returns without outstanding small companies. In our first quarter’s Advisor Insights Slides, we provided nine case studies of micro-cap companies we believe are poised for success. Call or email us if you would like to see that full presentation. Below is a highlight:
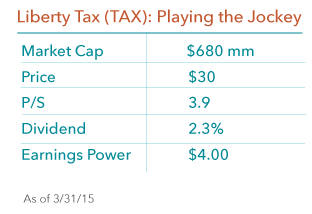
Liberty tax is the 3rd largest tax franchise company in the world, and you may know its leader. CEO John Hewitt has a past record of success, having built Jackson Hewitt to 1300 offices within a 15 year period before selling to Arthur Anderson for $483 million in 1997. We invested with Mr. Hewitt during his tenure at Jackson Hewitt and are excited at the prospect of his goal to build Liberty Tax into the largest preparation tax service company. The company recently introduced a quarterly dividend, showing evidence that management (40% insider-owned) is confident with its business model. TAX trades at 15 times forward earnings, but based on our analysis we believe earning power is in excess of $4 per share within the next three years.
Attribution Analysis – Biotech, biotech, biotech
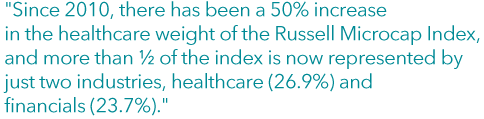
Once again, the Russell Microcap Index’s performance was driven by biotech companies in the first three months of 2015. In the quarter, the biotech sector returned an astonishing 23.2%, as compared to just 8.5% for the second-beset performing sector (Consumers Services?) and 3.14% for the Russell Microcap Index as a whole. We have spoken at length about the biotech story and what it may mean for investors in recent commentaries. As a reminder, since 2010, there has been a 50% increase in the healthcare weight of the Russell Microcap Index, and more than ½ of the index is now represented by just two industries, healthcare (26.9%) and financials (23.7%). We don’t know exactly when or how this plays out, but it certainly poses risks to passive micro-cap investors.
Perritt Low Priced Stock Fund Three Year Performance Number
As a reminder to our shareholders, the Perritt Low Priced Stock Fund (PLOWX) will earn its three-year performance track record on June 30th 2015. The Fund invests in micro-cap and small-cap stocks priced under $15 per share and $3 billion market capitalization, using the same disciplined Perritt investment process and team. Please check back at the end of June for PLOWX’s three year performance number!
Kiplinger – March, 2015
In this Kiplinger.com feature “8 Stocks Under $10 Worth Buying,” the Perritt Low Priced Stock Fund (PLOWX) is highlighted for it’s process of investing in stocks priced at $15 or less. Both Portfolio Managers Michael Corbett and Brian Gillespie provide thoughts on attractive, low-priced companies. As written in the article, companies mentioned exhibit “some of the key attributes you want to see in any company: talented executives, growing sales or profits, and in-demand products or services.” The article goes on to describe how many investment professionals ignore low-priced stocks, making it highly possible to find considerable deals in an ignored corner of the market.
Manager Commentary, 4th Quarter 2014
Passive/Index Investors in Micro-cap: What do You Own?
“The bigger, the better” was the storyline in 2014. The trend for equity investors throughout last year was the wholesale shift toward large-cap US companies. This sentiment was a reversal of 2013, which was a great year for small company returns (45.62% for the Russell Microcap Index). In 2014, small/micro-cap stocks as measured by the Russell Microcap Index gave back much of 2013’s relative gains1, returning 3.66% as compared to 13.69% for the S&P 500 Index. As seen in the table below, the “bigger is better” performance trend existed within the small company universe as well.
Source: Capital IQ
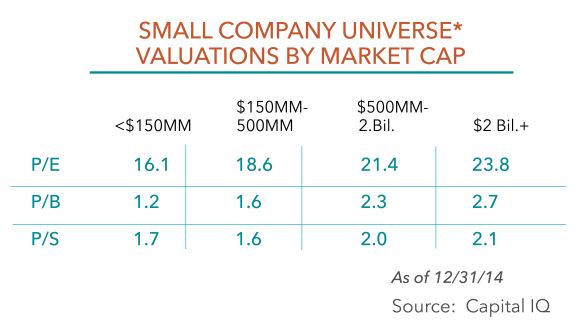
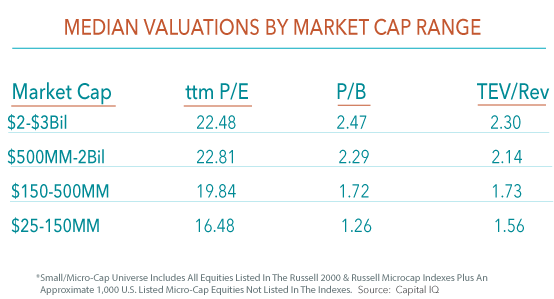
Last year’s move toward larger companies doesn’t change our outlook for micro- and small-cap companies. As seen in the valuations breakdown by market capitalization, the smaller capitalization companies are more attractively priced relative to larger market cap companies. Not represented in the table, however, is the fact that there are several companies within the universe, particularly within the Russell MicroCap Index, that have no earnings or revenue. This prompted us to provide an in-depth look at the index to help investors understand: if you invest passively in the micro-cap universe, what do you own?
The Russell Microcap Index is severely impacted by its holdings in Biotechnology and Pharmaceutical companies. In 2014, fourteen of the twenty best-performing stocks in the Russell MicroCap Index were Biotechnology or Pharmaceutical companies. Equally alarming, nearly 50 percent of the total return for the Russell Microcap Index came from just four Biotech/Pharmaceutical stocks. Those four names contributed 1.74 percent to the Index‘s total 3.66 percent return. A bright spot in an otherwise disappointing year, the Perritt Funds owned three of the six non-Biotech names that made up the remainder of Russell Microcap Index’s top-20 returns.
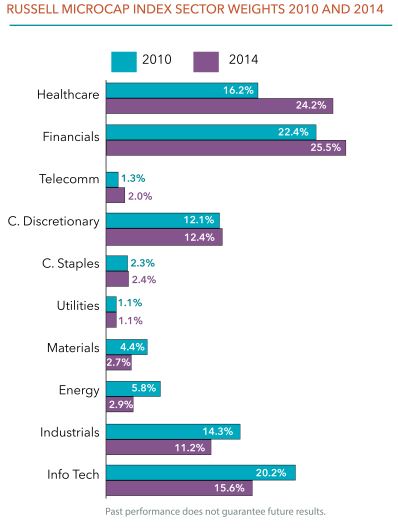
What does the significant overweight to Biotech companies mean for passive investors in the Micro-cap space? Because the Russell Microcap Index is market-cap weighted, the big Biotech winners of 2014 now represent some of the largest holdings in the Index. As a result, the composition of the Russell Microcap Index has changed dramatically since 2010. As seen in the table below, there has been a 50 percent increase in the Healthcare weight of the Index, offset by a 50 percent decrease in Energy, 40 percent decrease in Materials, and 20 percent decreases in Industrials and Technology. Digging deeper, we find the subindustries within the Healthcare sector of Biotech/Pharma account for 15.53 percent of Index, as compared to 8.3 percent in 2010. The Microcap Index now looks like a large bet on a group of Biotech companies, most with no revenue, no earnings, and lofty valuations.
Due to our strict discipline investment process, biotech companies rarely pass our quality tests. We admit our in-depth knowledge of companies within the biotech space is limited. However, the excitement and euphoria that is in place today sounds like a story we have heard before, and it doesn’t have a good ending. Let’s use some our quality measurements and give some insight into the biotech companies within the Russell MicroCap Index.
Of the few companies with revenues, biotech companies in the Russell Microcap Index are trading at a median price to revenue multiple of 31.9 as of 12/31/14. Current revenue multiples only tell a small part of the Biotech valuation story, however. Market expectations are based on the far-away future prospects of these companies. In fact, nearly 80 percent of Biotech companies in the Russell Microcap Index have a published analyst revenue forecast for 2018 (their median P/S ratio based on 2018 estimates is 2.7). That so many analysts are providing 2018 forecasts is astounding. To put it into perspective, less than 8 percent of companies held in the Perritt MicroCap Opportunities Fund (PRCGX) have a 2018 revenue estimate, and several of those were put on our watch list or sold for various reasons as gains after a 2018 revenue number was published. Tellingly, the 2018 analysts’ estimate was typically provided by the same firm that had bankers who helped to leverage a company to the detriment of its balance sheet.

It is difficult to forecast results for the next year, or even next quarter. We question how analysts can predict revenue for these Biotech companies four years into the future. There are so many if/then hurdles that need to be passed for these 2018 forecasts to come to fruition: if the Federal Drug Administration (FDA) approves a drug; then, if the company is able to market it; then, if consumers will buy it; then, if company management will prove to act in shareholders’ interest. Perhaps a select few companies will manage to accomplish all of these milestones and meet their lofty expectations. However, given the lofty valuations of the sector, the Biotech companies that may succeed are priced for perfection, the rest are priced for disaster. Even if a select few biotech companies survive and thrive, the lofty valuations of the group and “bubble-like” appearance of the space tells us this story will not have a happy ending.
Source: Capital IQ
Undiscovered, Underfollowed, Under-researched
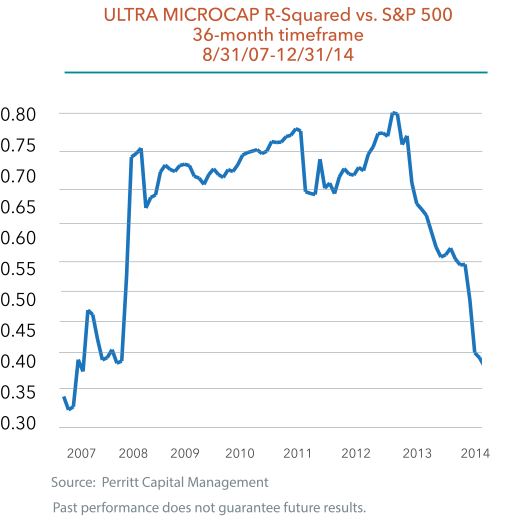
We remind our shareholders and prospective investors that the stock market is not a market of indexes, but that it is a market of companies. While certain small/micro-cap industries or individual companies are very expensive (in our view), there are definite pockets of opportunity to be found. An offshoot of the current market trends is the fact that the correlation for our actively managed small company portfolios has continued to decline. As seen below, the r-squared of the Perritt Ultra MicroCap Fund is now 0.41 vs. the S&P 500 Index as of 12/31/14 (versus the Russell 2000 Index, the r-squared is 0.55).
Low correlation is one of the key reasons why we believe so passionately that investors should allocate to actively managed micro-cap equity. Companies that are far off the radar of traditional Wall Street analysts are often inefficiently priced and uncorrelated to the market. The effect of lower correlation on investor portfolios can be significant. As we outlined in our research paper Adding Micro-cap to Small-cap, our research shows that complimenting your small-cap allocation with an investment in micro-cap has lowered correlation and can actually help reduce volatility. Part of the reason that this benefit has proved possible is the lower correlation historically delivered by an investment in micro-cap.
Dollar Strength and Small-Cap Stock Returns
Investors have seen a resurgence in the dollar recently, causing many to examine if the current dollar strength is indicative of future behavior in the stock market. History has in fact shown that a stronger dollar has been better suited for Small-Cap stocks than Large-Cap stocks. Currently, we believe that the dollar is strong for a few reasons. The first one being that US interest rates (while historically low domestically) are higher than worldwide markets. The second reason for a strong dollar is the strength of the current U.S. economy. With these characteristics combined, the strength of the dollar should continue its run, leaving us to ask: Will the money begin to flow to Small-Cap stocks?
Small-Caps have outperformed Large-Caps during periods of sustained dollar strength
During periods of dollar increases of 15% or more, Small-Caps, as represented by the Russell 2000 Index, has achieved an annual total return of 13.2% versus 10.3% for the S&P 500, which represents Large-Cap stocks. On the flip side, when the dollar was weak, Small-Cap stocks compounded at 9.5% compared to the S&P 500’s return of 11.1%. In the below chart you can see the historical relationship between the dollar and small-cap returns starting in the 1970’s.
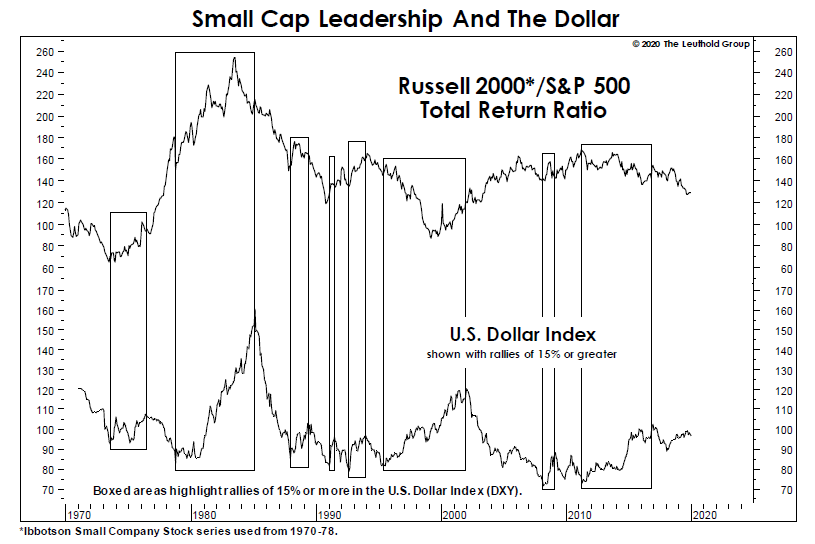
*The chart depicts historical differences in total returns between small-cap stocks (Russell 2000 Index) and large-cap stocks (S&P 500) as compared to movements in the U.S. Dollar Index, dating back to 1970. The top line represents the return ratio of the Russell 2000 Index to the S&P 500 Index; or the return of the Russell 2000 Index divided by the return of the S&P 500 Index. The bottom line represents the U.S. Dollar Index. The boxed areas highlight rallies of 15% or more in the U.S. Dollar Index (DXY).
Why is a strong dollar good for Small-Caps?
In our opinion, small-caps are more levered to the domestic economy than larger companies are. Small companies are more likely to sell products domestically, insulating them from the loss of competitiveness and currency translation impact of a stronger dollar. When the dollar is strong, multi-national corporations lose a competitive advantage, as foreign buyers see U.S. goods as more expensive than non-U.S. goods.
Another less discussed idea is that a stronger dollar may end up having similar effects as did the Fed’s Quantitative Easing (QE). Money looking for return generally flows toward more “risky” assets, such as Small-Caps. One possibility is that instead of the Fed pumping more dollars into the market, it will be foreign investors looking for better returns who will be pumping dollars into the market. Just when the Fed ends QE, it appears foreign buyers are stepping in looking for dollars and dollar-denominated assets. QE has been very positive for stocks in general and Small-Cap stocks in particular. Could the strong dollar be signaling a new round of increased risk appetite for US assets?
We like to say that “history doesn’t repeat, it rhymes.” In the above chart, investors will see that in some cases (an instance in the late 1990’s) Large-Caps outperformed Small-Caps in the time of a strong dollar. With the recent re-emergence of dollar strength beginning in April of 2011, we see a potential “rhyming” effect with late 1970’s-early 1980’s positive outperformance for Small-Cap stocks. Investors who wish to participate in improvements in the U.S. economy and rising dollar may wish to look to small/micro-caps with more domestically-driven revenue sources, and potentially more attractiveness to foreign dollar flows. Buy small, Buy American, it could be the trend for 2020.
Manager Commentary, 3rd Quarter 2014
Willamette Valley Vineyards (WVVI) Case Study
As discussed in our 2Q14 Commentary, the micro-cap market entered a “stealth bear-market” earlier this year. As of the end of the third quarter, this trend has obviously continued, as negative breadth grew and the overall small-cap indexes turned negative. We view this “stealth bear-market” as a great opportunity for investors. We are working on a deep dive analysis of the micro-cap marketplace now. We will provide this supplement, which will include data points such as the number of companies trading below tangible book value, in the coming weeks. For our regular commentary, please enjoy this exciting story about one of our portfolio holdings.
What does it mean to invest with an active manager of micro-cap equities? Remember that the assets you allocate to the Perritt Funds are invested in the growth of individual small companies. the majority of these companies are led by true entrepreneurs – men and women – each with a story to tell about their business and their vision of reaching the next level. Analyzing these stories is a key element in our investment process. It can direct our focus toward companies where the opportunity ends up being the greatest.
When researching micro-cap equities, balance sheets, valuations, and economic trends all matter. But as bottom-up, fundamental investors, getting to know management teams is where the true opportunity of a company is often revealed. Our passion for our work in this asset class is fed by the access we are granted by small company management teams on a daily basis. If we were investing in Pepsico, or any other large-cap company, the CEO likely wouldn’t even return our call. As shareholders in Willamette Valley Vineyards, CEO Jim Bernau didn’t just pick up the phone, he invited us on a tour of his winery (supported by 526 owned and leased vineyard acres) outside of Portland, OR.
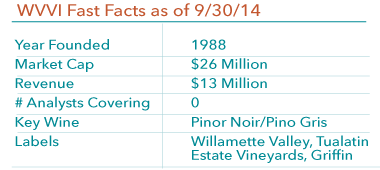
As mentioned above, this quarter we break from our normal Manager Commentary format and provide a cast study of Willamette Valley Vineyards. Below are highlights from conversations we’ve had with Jim which contributed to our analysis and decision to purchase the stock. The focus here is not on our story (examining analyst coverage, our nine-point evaluation or stock valuation) it is on Jim‘s story – the founding and ongoing success of Willamette Valley Vineyards. Jim’s story is a a fascinating one which we hope will help shed light on this personal, essential part of our investment process.
Fermentation: “I Started Selling Wine Out Of The Back Of My Car”
Perritt: By any stretch of the imagination, WVVI wasn’t a traditional IPO listing. Tell us about your journey.
Jim Bernau: My vision was to organize wine enthusiasts as owners of a winery. So I started out with the goal of being publicly traded. I started in 1987 with my application to the SEC and Blue Skied a number of states that were targeted for Pinot Noir enthusiasts. It was a very unusual mode; I hadn’t produced any wine before I started selling shares. But I had done some political fundraising when I was younger and use some of those marketing techniques to get people to order a prospectus. For example, I took the tombstone advertising requirements and converted them to things that looked like a wedding invitation. I wanted to identify what my affinity group was by taking my information out to wine festivals. So I hired a group of 5th graders to speak into tape recorders and record license plates of people who attended large wine festivals. Then I ran those plates through the Dept. of Motor Vehicles to identify the owners who I would then send invitations to order a prospectus. Maybe not surprising, I got a really high take rate on identifying those kinds of groups. Those are the offerings I did that funded the company. Soon I started selling wine out of the back of my car and even got some shareholders to help sell wine out of their cars, and it all worked.

Jim Bernau, CEO Willamette Valley Vineyards
The Barreling: “It Took Over 31 Years To Become An Overnight Success”
Perritt: To us, this past year appears to be an inflection point for your business.
Jim Bernau: It became very clear to me that to achieve world class status as an iconic Willamette Valley Vineyard Appalachian producer, I needed to have a very sharp focus on Pinot Noir. The Oregon wine industry is young in comparison to California or France. In 1966, there were only two commercial wineries licensed in the state. Today there are 545 and the industry has doubled in the last 10 years. Because of climate, soil and other growing conditions, Oregon has carded out this little niche of very high quality wine focused on Pinot Noir.
About 50% of our production in sales is Pinot Noir and we have really carved out a very strong brand position for that variety. And we’re growing: recently I acquired 80 acres right next to Elton Vineyards (a vineyard leased by Willamette valley) where we’re planning fifty-five acres this year after planting eighteen acres last year, and we have leased another 109 acres to plant.

Perritt Capital Management Staff and Board of Directors
As Oregon wineries have continued to populate and become known, this is a distinct advantage for us. There is a cacophony of brands in the valley now, but we’re Willamette Valley Vineyards – we own the trademark. So as time goes on, our ability to stand out with this iconic brand improves as the reputation of the valley improves, as long as we continue doing our homework and making great wine.
We’ve had some designations from different reviewers. We’ve had one from Wine Enthusiast Magazine called us one of the great wine producers. We had one from Wine & Spirits Magazine name us one of the top 100 wineries in the world. I would say the wines we’re now releasing, the 2012 Pinot Noirs will likely be regarded as the best that the industry has even made, and certainly the best we at Willamete Valley as ever made. We are just starting to get reviews on those, we just received 93 points from Wine & Spirits Magazine which is a high score. We’ve cared out a market niche where majority of our sales of Pinot Noir range from $22 to $30 a bottle. We’re serving a national and international segment in the market that I will continue to hammer home on a long term basis. And there’s not very many of us that compete in that segment. For example, we are a size where we can serve a national chain. If you go to Ruth Chris, our Pinot Noir and Riesling is on the wine list. That’s just one example.
The Vision, Uncorked: “Come and Be Entertained”
Perritt: You used retained earnings to make a sizable investment in the winery.
Jim Bernau: Consumers have changed what they want in recent years. It used to be tasting rooms where more primitive, people would come in and taste and move on. Now people want to come and be entertained. They want to have activities and different levels of experiences that are more positive and memorable. We made a significant investment in creating a world class winery destination experience here. We just had our grand opening in May and it’s really working. We probably have one of the few wineries that has a chef and a chef station in the tasting room. We have hospitality lodging adjacent to the winery. And we’ve recruited some top talent: Isabelle Meunier, the highest rated wine maker in making chardonnay from Oregon, has come on board. Drew Voigt, who used to be at Domaine Serene (another Oregon Winery) is also working with us.

I am always focused on what am I doing to increase the strategic value of the business. Making our winery a true destination is one element. Benefiting from our trademark and growth in the region is another. When I think about the decision making, I think about what would create the highest value to our shareholders. If you look at my vineyard strategy, we’ve got to be close to the largest Estate winemaker in Oregon. I developed an inventory of future vineyard land I’ll be planting a number of years into the future. That increases our strategic value because any acquirer would want to make sure they can grow the brand they purchased.

Jim Bernau, CEO Willamette Valley Vineyards and Mike Corbett, PM/CIO Perritt Capital Management
The SUIT – September 2014
In this interview with The SUIT Magazine, Portfolio Manager Michael Corbett discusses how he strives to educate potential investors on the prospective value of investing in micro-cap and small businesses. He also explains how “much of the excitement in our economy is focused now on small business.”
Click here to read the full article on TheSuitMagazine.com.
Manager Commentary, 2nd Quarter 2014
The Greatest Story Never Told
Examining the ‘Stealth Bear Market’ within Small Company Indexes
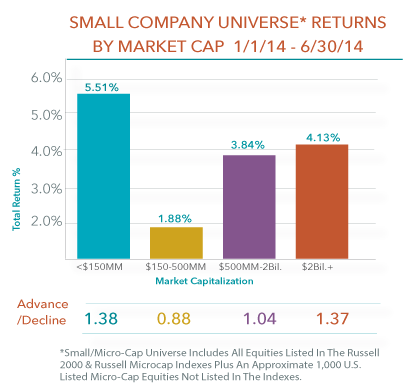
Small and large company equity performance has continued to diverge in the first half of 2014. Small companies significantly outperformed large-cap equities in 2013. This year we have seen a reversal, as smaller company equities have lagged large-cap stocks through June 30. Recent trends have led to sweeping claims that small-cap valuations have become “stretched.” Is this true? This quarter we will attempt to show how investors can determine the answer for themselves by digging through the actual companies listed in the indexes.
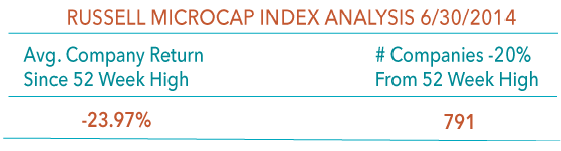
The stock market is not a market of indexes, it is a market of companies. When you actually examine the individual names that form the small company indexes, what we see is that we have experienced a “stealth bear market” in smaller company stocks: the average stock in the Russell Microcap Index has fallen -23.97% from its 52-week high. Significant declines are broad-based, as 791 companies have fallen 20% or more from their 52-week high. What this means is that while certain small/micro-cap industries or individual companies are indeed expensive (in our view), there are certainly pockets of opportunity to be found.
Past performance does not guarantee future results.
Small company indexes are at or near all-time highs, yet the majority of individual names have fallen 20% below their 52-week high. How can we explain this condition? Performance analysis shows that Index returns are being driven by a smaller number of high-flying biotech and internet software stocks. As fundamental, value-oriented managers, we believe these investments carry significant risk. names such as Open Table (OPEN), Yelp (YELP), and Zillow (Z) may benefit from consumer recognition and investor excitement, but their current market valuations may not be justified in the future.. We believe that true small company opportunities – names with strong potential earnings power and valuations that aren’t “stretched” but “compressed” – lie elsewhere.
Past performance does not guarantee future results.
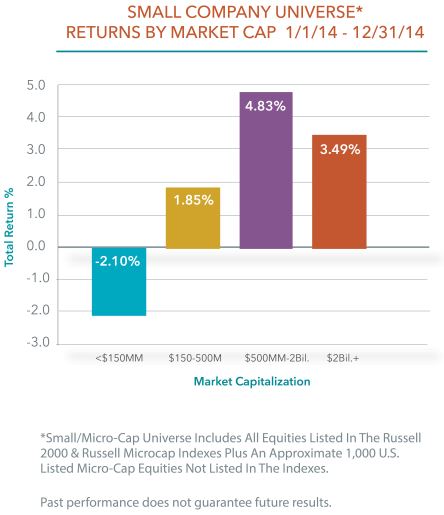
Performance within the small cap universe has also diverged in the first half of 2014, as seen in our table above. Excluding the group of companies with a market capt under $150 million (which includes many penny stocks susceptible to volatile performance swings), the larger the company the greater the return. Investors can sketch a rough chart ranking 2014 performance by asset class and see a linear climb: large-caps performed best, followed by mid-cap, then small-cap, and finally within small-cap where the smaller companies have the least return.*
We hesitate to draw and conclusions about such short term returns signifying a new trend. It is possible that this is the start of a period of large-cap outperformance. Equally likely is that we are seeing a natural reversion following 2013’s significant outperformance by smaller companies, and we are still in a market where smaller companies are in favor. What does appear material to us is the decreasing level of correlation between the large- and small/micro-cap asset classes.
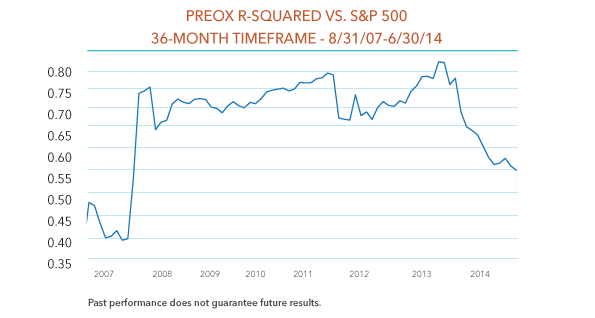
Low correlation is one of the key reasons why we believe so passionately that investors should allocate to micro-cap equity. According to Ibbotson & Associates**, between 1926 and 2013 smaller company returns have had a correlation of 0.80 to larger company returns. Micro-cap returns should provide investors with even lower correlation than small companies, as micro-cap companies are generally far off the radar screens of traditional Wall Street analysts. Following the financial crisis, returns of all asset classes, including micro-cap equity, began moving in sync and correlation increased. As seen below, over the past year and a half this trend has started to reverse. The r-squared of the Perritt Ultra MicroCap Fund, having tracked generally near 0.75 for the past five years, has begun to decline to pre-2008 levels.
The effect of lower correlation on investor portfolios can be significant. As we will outline in an upcoming research paper, Adding Micro-cap to Small-cap, our research shows that complementing your small-cap allocation with an investment in micro-cap has lowered correlation and has helped reduce volatility. Part of the reason that this benefit has proved possible is the lower correlation historically delivered by an investment in micro-cap.
Dig through the individual names in an index and you can see widely varying returns and valuation characteristics. Our final chart below compares valuation metrics according to company size within the small company universe. As can be seen, the smaller the company, the lower the valuation. This holds true for P/E, P/B and Total Enterprise Value/Revenue (TEV/Rev).
Perhaps we have been in this business for too long, but the below chart made us reflect on the “good old days” of the 1970’s and 80’s, when growing small companies were rewarded with higher valuation multiples. In the era when our firm was founded, investors paid a premium to own fast-growing, dynamic small companies. Today, it seems normal for large, consumer staple-type companies to be rewarded with lofty multiples, despite internal growth rates of just a few percentage points per year. Conversely, many small companies growing at 15-20% per year are valued at a discounted multiple. Perhaps this is another example of the famous “new normal,” but it seems backwards in our view.
Click here for standardized fund performance.
Performance data quoted represents past performance; past performance does not guarantee future results. The investment return and principal value of an investment will fluctuate so that an investor’s shares, when redeemed, may be worth more or less than their original cost. Current performance of the fund may be lower or higher than the performance quoted. Performance data current to the most recent month end may be obtained by calling (800) 331-8936. The funds impose a 2% exchange and redemption fee for shares held 90 days or less. Performance data quoted does not reflect the redemption or exchange fee. If reflected, total return would be reduced.
Morningstar Investment Conference 2014
Portfolio Manager Michael Corbett, Executive Director of Client Relations Mark Oberrotman and Institutional Client Relations Sean Condon at the Perritt Capital Management booth while exhibiting at the Morningstar Investment Conference 2014.

The Morningstar Investment Conference took place June 18-20th this year at McCormick Place in Chicago. The conference, one of the investment industry’s most respected annual events, provided investment advisors with knowledge, insights and resources on investment topics, financial topics and perspectives on the economy.
MarketWatch – June 2014
In this interview with MarketWatch’s senior columnist Chuck Jaffe at the Morningstar Investment Conference, Portfolio Manager Michael Corbett discusses the value of small and micro-cap stocks, and how high interest rates might affect small stocks and the Perritt MicroCap Opportunities Fund (PRCGX).
Click here to listen to the interview on MarketWatch.com.
Portfolio Manager Michael Corbett on a site visit to Deep Down, Inc. facility with Neil Stuckey, Operations Manager

Portfolio Manager Michael Corbett visited the facilities of fund holding Deep Down, Inc. in Houston, TX. Deep Down is a leading deep sea oilfield services company providing sub-sea solutions for the world’s energy and offshore industries. In the background of the above photo is a proprietary Flying Lead Deployment Frame, a piece of equipment which stabilizes on the sea floor and provides support for deploying electrical, hydraulic and optical flying leads.
Crain’s Chicago Business – March 2014
In this Crain’s Chicago focus piece, the Perritt Ultra MicroCap Fund was highlighted for its 2013 performance, due in part to seeking ‘broken Initial Public Offerings’, companies that have stumbled after selling stock to the public. The article titled “Perritt: The Little Stock Fund Engine That Did” also highlights Perritt Capital Management’s launch of a new mutual fund The Perrritt Low Priced Stock Fund (PLOWX), that will focus on slightly bigger companies, those with less than a $3 billion market cap.
To view the article, visit Crain’s Chicago Business.
Portfolio Manager Audio – March 2014
In this interview, Portfolio Manager Michael Corbett discusses the launch of the new Low Price Stock Fund (PLOWX), the uniqueness of the firm’s process, keys to Perritt Capital Management’s success and the firm’s goals for 2014.
Click below to listen to the interview with Michael Corbett.
Manager Commentary, 1st Quarter 2014
History Doesn’t Repeat, It Rhymes
How Strong are the Future Prospects of Small Companies?
While today’s P/E’s do present some challenge, valuations are not the only factor which drive small-cap returns . In 2013 small-cap stocks were called too expensive by many, yet The Russell Microcap Index led the market with a 45.62% return. This should be a reminder that valuations reflect past earnings. Looking at the past may show us if a market is pricey or inexpensive, but it can’t predict the direction or size of future returns. Returns are determined by current price and future prospects. This is the question we analyze in meetings with management teams daily: how strong are the future prospects of small companies?
No two market cycles are alike, but as we often say: history doesn’t repeat, it rhymes. Prior market cycles can be linked to the present by studying financial conditions. Do financial conditions – interest rates, liquidity, economic trends – promote strong future prospects and earnings power?
Looking at financial conditions, our current environment most closely resembles the period of ‘75-’82, a phenomenal bull market for small-cap stocks. As seen in the table below from Furey Research Partners, financial conditions are historically a good indicator of future small-cap returns (The Financial Conditions Index represents the level of real interest rates, 10-year yields and the trade weighted dollar). Investors may be surprised to learn that the current small-cap bull market lags the ‘75-‘82 run significantly. Between 1/1/75 and 12/31/82, small cap stocks1 returned 1,419.43% (35.3% annualized). Notably, during this period small cap stocks continued to rise in spite of interest rate increases, a historical lesson that might calm fears that small-caps can’t perform in rising rate environments.
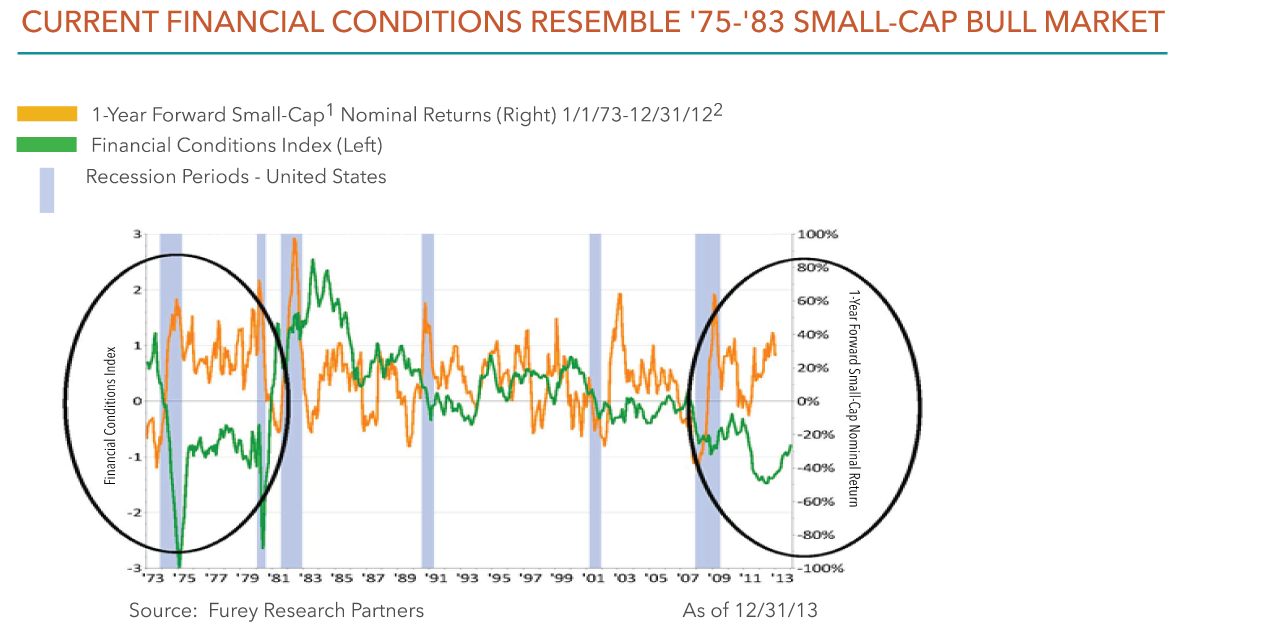
21-yr Forward Small-cap nominal returns represent the total return for the period beginning at any point on the chart and ending one year later. For example, the 1-yr forward small-cap nominal return on 12/31/02 represents the 60.70% return of small-cap stocks between 12/31/02-12/31/03.
In our view, the highly simulative Fed policies (which may continue for years, even after rates begin to rise) create an environment that has historically justified higher P/E’s. We build our portfolios from the bottom-up seeking to uncover individual opportunities. As we discussed in our last research paper, the micro-cap asset class is vast, enabling active managers the opportunity to find stocks with much different valuations than the “headline” P/E of the market index. Based on our individual company analysis, along with current financial conditions, we are confident in the future prospects of small companies.
One Door is Closed, Another is Open: Launch of Low Priced Stock Fund
In order to keep our commitment to investing in the smallest companies available on public exchanges, we have begun the process of soft-closing The Perritt Ultra MicroCap Fund (PREOX). We have talked openly about the capacity constraints of the Fund. Although the current asset levels are not pushing us to our absolute limit, we are confident that starting the process of a soft-close now is in the best interest of our shareholders. Financial advisors and retirement plans with clients in the Fund prior to the closure will be able to continue investing in the Fund for existing as well as new clients. Call Mark Oberrotman at 800-331-8936 for more information on how this might affect you specifically.
We have launched The Perritt Low Priced Stock Fund (PLOWX) to take our proven (since 1987) investment process in micro-cap stocks and add small-cap stocks to broaden our opportunities.
The Fund will invest in micro-cap and small-cap stocks priced under $15 per share and $3 billion market capitalization when purchased, providing plenty of room to move. We will follow the same investment and stock selection process and research team that has been part of our firm’s twenty-five years of experience investing in smaller companies. Our Low Price approach should fit in its niche as it is one of just three Low Priced Stock Mutual Funds available to investors.
Our investment process utilizes a bottom-up approach, favoring fundamentally sound companies with modest valuation multiples relative to long-term growth prospects. The Low Priced Stock Fund investable universe includes 2,119 stocks as of 2/28/14. Steps in our investment process include:
- Companies are first subjected to a nine-point evaluation — based on balance sheets, cash flow statements and income statements — that we believe demonstrates whether a company is acting in the interests of its shareholders.
- For companies whose fundamentals look favorable based on the nine-point evaluation, the next step is to assess its broader business prospects. The focus of this step is to identify growing, niche companies with innovative products and/or services and the potential to build franchises and brand.
The co-portfolio managers of the Perritt Low Priced Stock Fund are Michael Corbett, our Chief Investment Officer (with the firm since 1990), who is joined by portfolio manager, Brian Gillespie who has been working side-by-side with Mr. Corbett since 2005. Michael has served as Portfolio Manager for the MicroCap Opportunities Fund (PRCGX) since 1999 and the Ultra MicroCap Fund (PREOX) since 2004.
Click here for standardized fund performance.
Performance data quoted represents past performance; past performance does not guarantee future results. The investment return and principal value of an investment will fluctuate so that an investor’s shares, when redeemed, may be worth more or less than their original cost. Current performance of the fund may be lower or higher than the performance quoted. Performance data current to the most recent month end may be obtained by calling (800) 331-8936. The funds impose a 2% exchange and redemption fee for shares held 90 days or less. Performance data quoted does not reflect the redemption or exchange fee. If reflected, total return would be reduced.
Meet the Team – Mark Oberrotman, Executive Director of Client Relations

Mark’s professional career covers an interesting spectrum of experience. He joined Perritt Capital in 2004 and has more than twenty-five years of experience in the investment industry.
As a graduate of the University of Illinois with a degree in Mechanical Engineering he started right out the gate into the engineering world with an old line Fortune 500 company, Continental Can. Mark started his financial services career with Thomson McKinnon Securities as a stock broker working with high net worth individuals. An early experience of the 1987 market crash opened his eyes to how the market works as well as gave him plenty of stories (which we are tired of but please ask him to share).
In the early days if you didn’t have connections you built your business by going door to door, making cold calls, or both, which Mark did until eventually managing as much as $50 million. Mark’s experience managing clients and his own book of business has helped him connect with Advisors with whom he is often found coaching on life and business strategy along with the merits of small/micro-cap-company investing.
Mark met Perritt Capital owner and Portfolio Manager Michael Corbett more than fifteen years ago after discussing small company names as a sell-side broker. At Perritt you will find Mark opening up distribution agreements, creating marketing materials and tending to the needs of clients.
Mark enjoys international and outdoor travel and has recently visited Istanbul, Australia, Galapagos Islands, Europe as well as national parks like Yosemite, Tetons and Yelllowstone.
The information provided herein represents the opinion of Perritt Capital Management and is not intended to be a forecast of future events, a guarantee of future results, nor investment advice.
Fidelity Investments – February, 2014
The Perritt Ultra MicroCap Fund (PREOX) was named as a Fidelity Fund Pick in the Small Value Category as of 2/28/2014. Fund Picks from Fidelity identify funds according to their historical investment styles as measured by portfolio statistics and composition over the past three years. Fidelity screens for Fund Picks using the following criteria and based on Morningstar asset classes, investment styles, and categories:
1. The universe of funds available for consideration are:
- Open End, No Transaction Fee mutual funds that are open to new investors and are available on Fidelity’s platform with a minimum investment of no more than $2500*
- $300 million in total assets (except for mid-cap and small cap categories which are $200 million and $100 million, respectively)
- Funds that have a minimum 3 year performance
- Funds in the bottom 3 year performance quartile are eliminated
2. Funds are screened for each investment category and the top five Fidelity and top 5 non-Fidelity mutual funds are chosen as “Fund Picks” based on:
- Funds with the highest three-year historical risk-adjusted returns within their respective investment category
![]()