

Philosophy
Micro-Caps Have Posted Strong Long-Term Returns
The Small Firm Effect—smaller companies have historically provided strong absolute and risk-adjusted returns1 (For more information please click here for our whitepaper, The MicroCap Advantage: How MicroCap Equities Enhance Return and Lower Correlation in Client Portfolios)
- Investing in fundamentally and financially sound companies offers growth potential while potentially decreasing downside risks
- Ensuring that reasonable valuations are paid for sound companies may contribute significantly to long-term returns
- Employing a well-diversified portfolio can reduce company and industry specific risk
- Reducing the costs of investing by maintaining a low portfolio turnover ratio and a long-term investment horizon can contribute positively to returns
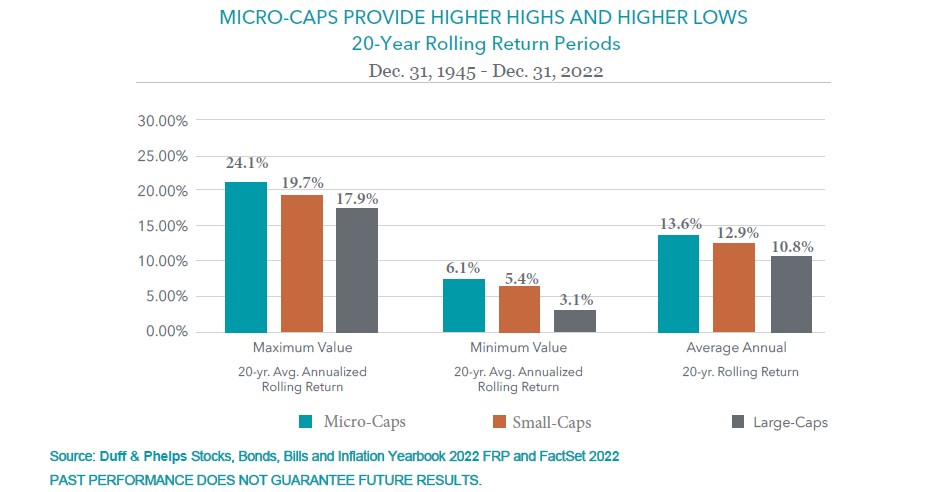
Source: FRP, Morningstar and FactSet as of 12/31/22.
Micro-caps are measured by the Russell Microcap Index, Small-caps by the Russell 2000 Index, Mid-caps by the Russell Midcap Index, and Large-caps by the S&P 500 Index.
Russell Microcap Index is a capitalization weighted index of 2,000 small-cap and micro-cap stocks that captures the smallest 1,000 companies in the Russell 2000, plus 1,000 smaller U.S.-based listed stocks. Russell 2000 Index is an index that measures the performance of approximately 2,000 small-cap companies in the Russell 3000 Index, which is made up of 3,000 of the biggest U.S. stocks. Russell Midcap Index measures performance of the 800 smallest companies (31% of total capitalization) in the Russell 1000 Index. S&P 500 Index is an index of 500 stocks seen as a leading indicator of U.S. equities and a reflection of the performance of the large cap universe. One cannot invest directly in an index.
1 “The Relationship Between Market Value and Return of Common Stocks.” Rolf Banz, Journal of Financial Economics, November, 1981.
This chart illustrates the performance of a hypothetical $1 investment made from 12/31/1925 to 12/31/2019. It assumes reinvestment of dividends and capital gains, but does not reflect the effect of any applicable sales charge or redemption fees. This chart does not imply any future performance.
Diversification does not assure a profit or protect against a loss in a declining market.
Performance data quoted represents past performance; past performance does not guarantee future results. The investment return and principal value of an investment will fluctuate so that an investor’s shares, when redeemed, may be worth more or less than their original cost. Current performance of the fund may be lower or higher than their original cost. Performance data current to the most recent month end may be obtained by calling (800) 331-8936. The funds impose a 2% redemption fee for shares held less than 90 days. Performance data quoted does not reflect the redemption fee. If reflected, total return would be reduced.