Manager Commentary-Archive
Manager Commentary, 4th Quarter 2014
Passive/Index Investors in Micro-cap: What do You Own?
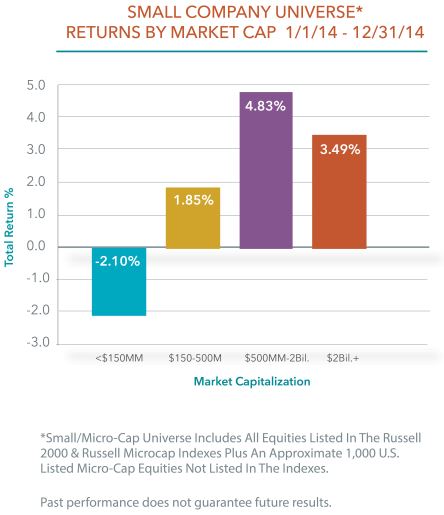
“The bigger, the better” was the storyline in 2014. The trend for equity investors throughout last year was the wholesale shift toward large-cap US companies. This sentiment was a reversal of 2013, which was a great year for small company returns (45.62% for the Russell Microcap Index). In 2014, small/micro-cap stocks as measured by the Russell Microcap Index gave back much of 2013’s relative gains1, returning 3.66% as compared to 13.69% for the S&P 500 Index. As seen in the table below, the “bigger is better” performance trend existed within the small company universe as well.
Source: Capital IQ
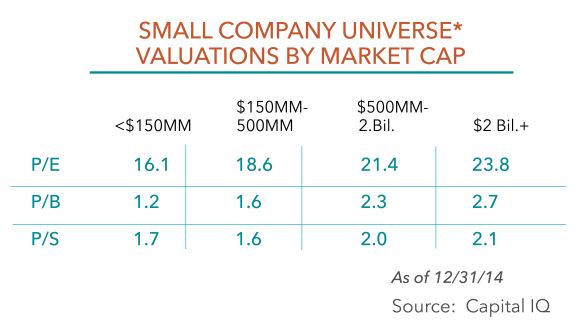
Last year’s move toward larger companies doesn’t change our outlook for micro- and small-cap companies. As seen in the valuations breakdown by market capitalization, the smaller capitalization companies are more attractively priced relative to larger market cap companies. Not represented in the table, however, is the fact that there are several companies within the universe, particularly within the Russell MicroCap Index, that have no earnings or revenue. This prompted us to provide an in-depth look at the index to help investors understand: if you invest passively in the micro-cap universe, what do you own?
The Russell Microcap Index is severely impacted by its holdings in Biotechnology and Pharmaceutical companies. In 2014, fourteen of the twenty best-performing stocks in the Russell MicroCap Index were Biotechnology or Pharmaceutical companies. Equally alarming, nearly 50 percent of the total return for the Russell Microcap Index came from just four Biotech/Pharmaceutical stocks. Those four names contributed 1.74 percent to the Index‘s total 3.66 percent return. A bright spot in an otherwise disappointing year, the Perritt Funds owned three of the six non-Biotech names that made up the remainder of Russell Microcap Index’s top-20 returns.
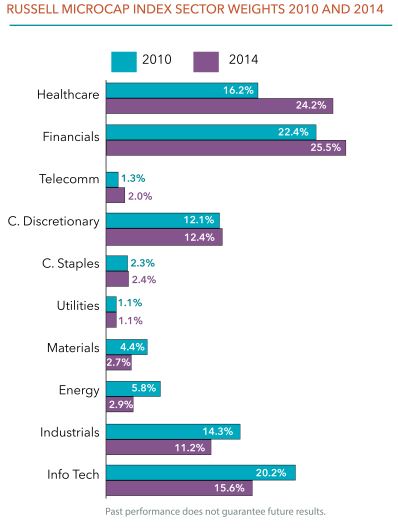
What does the significant overweight to Biotech companies mean for passive investors in the Micro-cap space? Because the Russell Microcap Index is market-cap weighted, the big Biotech winners of 2014 now represent some of the largest holdings in the Index. As a result, the composition of the Russell Microcap Index has changed dramatically since 2010. As seen in the table below, there has been a 50 percent increase in the Healthcare weight of the Index, offset by a 50 percent decrease in Energy, 40 percent decrease in Materials, and 20 percent decreases in Industrials and Technology. Digging deeper, we find the subindustries within the Healthcare sector of Biotech/Pharma account for 15.53 percent of Index, as compared to 8.3 percent in 2010. The Microcap Index now looks like a large bet on a group of Biotech companies, most with no revenue, no earnings, and lofty valuations.
Due to our strict discipline investment process, biotech companies rarely pass our quality tests. We admit our in-depth knowledge of companies within the biotech space is limited. However, the excitement and euphoria that is in place today sounds like a story we have heard before, and it doesn’t have a good ending. Let’s use some our quality measurements and give some insight into the biotech companies within the Russell MicroCap Index.
Of the few companies with revenues, biotech companies in the Russell Microcap Index are trading at a median price to revenue multiple of 31.9 as of 12/31/14. Current revenue multiples only tell a small part of the Biotech valuation story, however. Market expectations are based on the far-away future prospects of these companies. In fact, nearly 80 percent of Biotech companies in the Russell Microcap Index have a published analyst revenue forecast for 2018 (their median P/S ratio based on 2018 estimates is 2.7). That so many analysts are providing 2018 forecasts is astounding. To put it into perspective, less than 8 percent of companies held in the Perritt MicroCap Opportunities Fund (PRCGX) have a 2018 revenue estimate, and several of those were put on our watch list or sold for various reasons as gains after a 2018 revenue number was published. Tellingly, the 2018 analysts’ estimate was typically provided by the same firm that had bankers who helped to leverage a company to the detriment of its balance sheet.

It is difficult to forecast results for the next year, or even next quarter. We question how analysts can predict revenue for these Biotech companies four years into the future. There are so many if/then hurdles that need to be passed for these 2018 forecasts to come to fruition: if the Federal Drug Administration (FDA) approves a drug; then, if the company is able to market it; then, if consumers will buy it; then, if company management will prove to act in shareholders’ interest. Perhaps a select few companies will manage to accomplish all of these milestones and meet their lofty expectations. However, given the lofty valuations of the sector, the Biotech companies that may succeed are priced for perfection, the rest are priced for disaster. Even if a select few biotech companies survive and thrive, the lofty valuations of the group and “bubble-like” appearance of the space tells us this story will not have a happy ending.
Source: Capital IQ
Undiscovered, Underfollowed, Under-researched
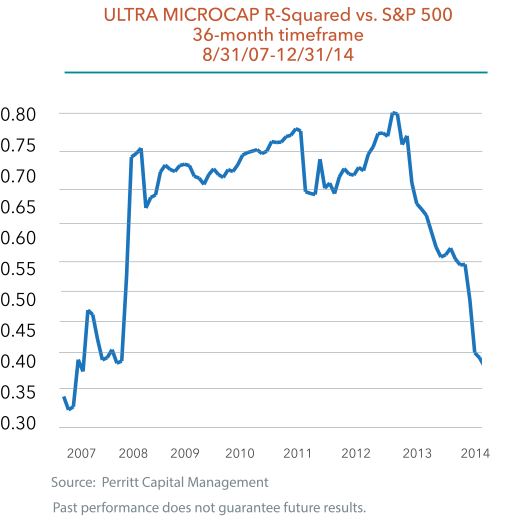
We remind our shareholders and prospective investors that the stock market is not a market of indexes, but that it is a market of companies. While certain small/micro-cap industries or individual companies are very expensive (in our view), there are definite pockets of opportunity to be found. An offshoot of the current market trends is the fact that the correlation for our actively managed small company portfolios has continued to decline. As seen below, the r-squared of the Perritt Ultra MicroCap Fund is now 0.41 vs. the S&P 500 Index as of 12/31/14 (versus the Russell 2000 Index, the r-squared is 0.55).
Low correlation is one of the key reasons why we believe so passionately that investors should allocate to actively managed micro-cap equity. Companies that are far off the radar of traditional Wall Street analysts are often inefficiently priced and uncorrelated to the market. The effect of lower correlation on investor portfolios can be significant. As we outlined in our research paper Adding Micro-cap to Small-cap, our research shows that complimenting your small-cap allocation with an investment in micro-cap has lowered correlation and can actually help reduce volatility. Part of the reason that this benefit has proved possible is the lower correlation historically delivered by an investment in micro-cap.