

Manager Commentary-Archive
Manager Commentary, 1st Quarter 2015
Size Wars: Return of the Small-Cap
“Size Matters Not,” said Jedi Master Yoda. Obviously, he never had to sit with a client comparing their portfolio to the S&P 500 Index. Jedi or not, as you know too well large-cap US companies were one of the best U.S. investments in 2014. In fact, large-cap stocks as measured by the S&P 500 Index returned 8.8% more than small caps as measured by the Russell 2000 Index in 2014, the best annual relative return for large-cap (as measured by the S&P 500 Index) vs. small-cap (as measured by the Russell 2000 Index) since 1998. But a curious trend developed at the end of 2014 and has continued through the first quarter of this year: the return of small company stocks.
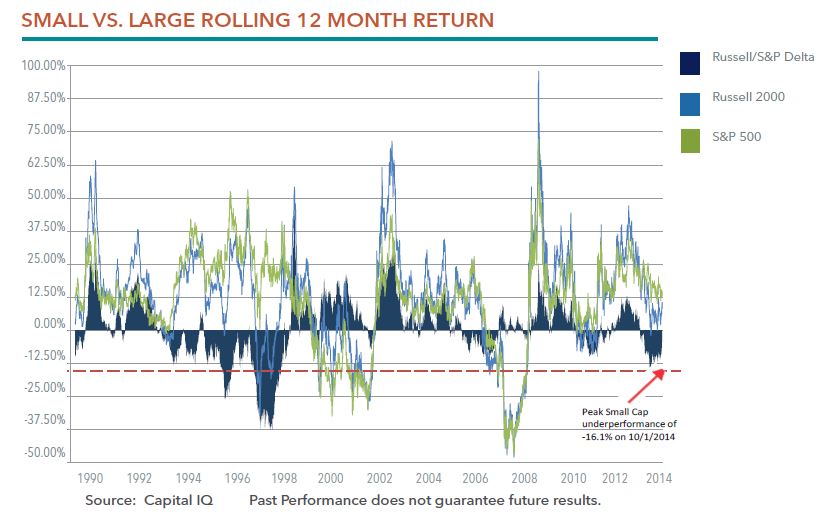
The chart below shows the 12-month rolling return difference between the S&P 500 Index and the Russell 2000 Index. As you can see, large-caps reached a peak level of outperformance vs. small-caps on October 1 of last year, at 16.1%. This was almost exactly at the average peak outperformance we have seen over the past twenty-four years. Perhaps not surprisingly, since October 2014 small-cap companies have begun to outperform the S&P 500 Index.
Following such strong returns in 2013, we were hesitant to make any bold predictions about future small-cap performance last year. Today, when we look at what seems to be a budding trend of small cap outperformance, we feel more confident. Here are four reasons why the recent trend of small-cap outperformance may be just the beginning: a strong dollar, higher earnings growth, abundance of quality companies, and potential earnings power.
Strong dollar is a positive for small-caps
As we explored in our research paper Dollar Strength and Small Cap Stock Returns, historically a strong dollar has been better suited for small-cap stocks than large-caps. A strong dollar hurts multi-national corporations as foreign buyers see U.S. goods as more expensive compared to non-U.S. goods. Since smaller companies rely more on domestic revenue, small-caps can thrive under these circumstances. We believe any ongoing trend of dollar strength should continue to propel small-cap relative returns.
Higher earnings growth at lower multiples
Where can investors find growth? The earnings growth forecast by large-cap companies has largely disappeared after several years of strong performance. As seen in the table below, the Earnings per share (EPS) growth forecasts for small companies is 24% for 2015, as compared to just 4% for S&P 500 companies. In fact, quality small companies which have been largely ignored by the market are providing investors with the highest earnings growth potential and at modest multiples.
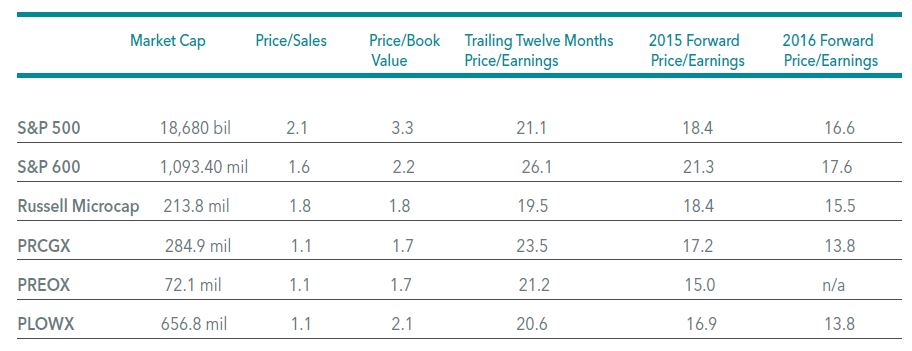
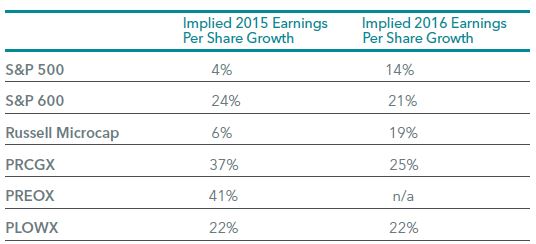
As of 3/31/15
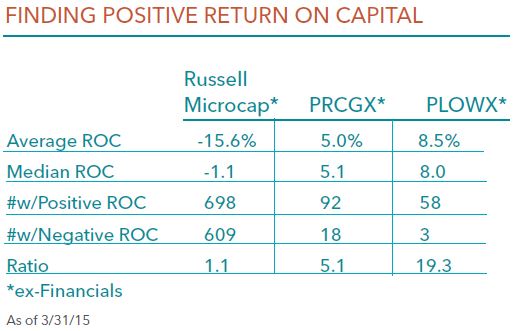
Quality companies and return on capital
With many thousands of companies to choose from, small- and micro-cap investors potentially have an advantage because they can build a portfolio that bears little resemblance to the benchmark. In our opinion, the current environment presents significant opportunities for bottom-up investors who focus on quality companies. Quality, as measured by return on capital (ROC), is in short supply if you are stuck in the micro-cap index. For an active manager, however, focused opportunities are abundant. As seen in the table below, the ratio of companies creating a positive return on capital versus those losing money is five-times greater in PRCGX than in the broader micro/small-cap market.
Case Studies: Outlook for Earnings Power on the Horizon
You can’t have strong small-cap relative returns without outstanding small companies. In our first quarter’s Advisor Insights Slides, we provided nine case studies of micro-cap companies we believe are poised for success. Call or email us if you would like to see that full presentation. Below is a highlight:
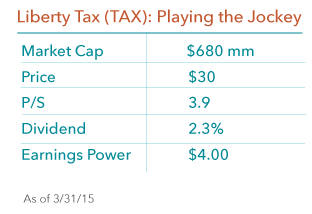
Liberty tax is the 3rd largest tax franchise company in the world, and you may know its leader. CEO John Hewitt has a past record of success, having built Jackson Hewitt to 1300 offices within a 15 year period before selling to Arthur Anderson for $483 million in 1997. We invested with Mr. Hewitt during his tenure at Jackson Hewitt and are excited at the prospect of his goal to build Liberty Tax into the largest preparation tax service company. The company recently introduced a quarterly dividend, showing evidence that management (40% insider-owned) is confident with its business model. TAX trades at 15 times forward earnings, but based on our analysis we believe earning power is in excess of $4 per share within the next three years.
Attribution Analysis – Biotech, biotech, biotech
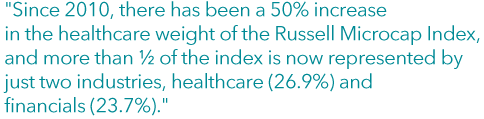
Once again, the Russell Microcap Index’s performance was driven by biotech companies in the first three months of 2015. In the quarter, the biotech sector returned an astonishing 23.2%, as compared to just 8.5% for the second-beset performing sector (Consumers Services?) and 3.14% for the Russell Microcap Index as a whole. We have spoken at length about the biotech story and what it may mean for investors in recent commentaries. As a reminder, since 2010, there has been a 50% increase in the healthcare weight of the Russell Microcap Index, and more than ½ of the index is now represented by just two industries, healthcare (26.9%) and financials (23.7%). We don’t know exactly when or how this plays out, but it certainly poses risks to passive micro-cap investors.
Perritt Low Priced Stock Fund Three Year Performance Number
As a reminder to our shareholders, the Perritt Low Priced Stock Fund (PLOWX) will earn its three-year performance track record on June 30th 2015. The Fund invests in micro-cap and small-cap stocks priced under $15 per share and $3 billion market capitalization, using the same disciplined Perritt investment process and team. Please check back at the end of June for PLOWX’s three year performance number!