

Uncategorized
Marin Independent Journal Trader’s Magazine – February, 2013
Portfolio Manager Michael Corbett is interviewed in this article as a shareholder of Hennessy Advisors following the announcement of an acquisition, which nearly tripled the assets under Hennessy’s management. Asked about the acquisition, Corbett said, “”By combining forces, (FBR and Hennessy Advisors) can generate some synergy and bring down costs.”
To read, visit marinij.com.
Trader’s Magazine – January, 2013
Director of Research/Equity Analyst George Metrou is interviewed in the article “Building Blocks for Building Block Trades.” In it, he describes Perritt’s “old fashioned” trading process of using a network of 40-to-45 brokers across the country who have established a relationship of trust with the team.
To read “Building Blocks for Building Block Trades,” visit Trade Magazine’s website.
InvestingDaily.com – February, 2013
The Perritt MicroCap Opportunities Fund is mentioned in this article devoted to explaining the potential benefits inherent in a space known for scarce information and limited liquidity. A detailed description of the team’s investment process is also included in the piece.
To read “Micro-Caps: Tiny Companies, Powerful Gains,” visit InvestingDaily.com.
Investment Advisor – June 2012
Investment Advisor Magazine features Michael Corbett, Portfolio Manager of the Perritt Funds, in the article “Managing Through the Micro-Cap Mania.” Corbett discusses why small-cap volatility doesn’t faze the investment team at Perritt Capital Management. Asked about volatility, Corbett notes that, “The possibility of shareholder value is significant because of how strong the balance sheets are.”
Both Perritt Funds are discussed in detail, including mention that “The Ultra MicroCap Fund has the lowest average market cap [for the companies which it invests] of any mutual fund out there,” according to Morningstar.com.
To read “Managing Through the Micro-Cap Mania,” visit Investment Advisor’s website.
Crain’s Chicago Business – December, 2012
George Metrou, Director of Research of the Perritt Funds, discusses John B. Sanfilippo & Son’s in the article “Does Fisher Nuts Have the Recipe to Win This War?” When asked about John B. Sanfilippo & Son’s success at increasing market share and diversifying its product line for it’s Fisher Nuts brand, George states: “We’re very happy with what the company has been doing. We decided to maintain our position because we saw them make a push to grab market share and diversify the product line.”
To read “Does Fisher Nuts Have the Recipe to Win This War?”, visit Crain’s Chicago Business’ website.
Crain’s Chicago Business – December, 2012
George Metrou, Director of Research of the Perritt Funds, discusses John B. Sanfilippo & Son’s in the article “Does Fisher Nuts Have the Recipe to Win This War?” Asked about John B. Sanfilippo & Son’s success at increasing market share and diversifying its product line for it’s Fisher Nuts brand, George states, “We’re very happy with what the company has been doing. We decided to maintain our position because we saw them make a push to grab market share and diversify the product line.”
To view “Does Fisher Nuts Have the Recipe to Win This War?” visit Crain’s Chicago Business.
Investment Advisor – June 2012
Investment Advisor Magazine features Michael Corbett, Portfolio Manager of the Perritt Funds, in the article “Managing Through the Micro-Cap Mania.” Corbett discusses why small-cap volatility doesn’t faze the investment team at Perritt Capital Management. Asked about volatility, Corbett notes that, “The possibility of shareholder value is significant because of how strong the balance sheets are.”
Both Perritt Funds are discussed in detail, including mention that “The Ultra MicroCap Fund has the lowest average market cap [for the companies which it invests] of any mutual fund out there,” according to Morningstar.com.
To view “Managing Through the Micro-Cap Mania” visit Investment Advisor Magazine.
Perritt Capital Management Launches New Website and Brand
Click here to read a press release regarding the firm’s launching of our new website and brand.
Perritt Emerging Opportunities Fund Changes Name to Perritt Ultra MicroCap Fund
Click here to read a press release regarding the name change of the Perritt Emerging Opportunities Fund.
Change in Majority Control of the Advisor to The Perritt Funds
Click here for important information regarding an agreement to transfer majority control of Perritt Capital Management from founder Dr. Gerald Perritt to Portfolio Manager Michael Corbett.
Manager Commentary, 2nd Quarter 2013
“I Get No Respect!” Until Lately….
Q: What Has Been The Cause Of The Outsized Returns Seen In Several Individual Small Company Names?
A: As Rodney Dangerfield might say: Respect. We understand that micro-cap is an inefficient asset class containing many misunderstood companies and select our individual stocks with great care. When companies are misunderstood by investors, you can find them priced to return many multiples of your initial purchase should the investment pan out. Patience is part of the micro-cap discipline, as it can take many years for a story to play out and for a company to finally get recognition. Lately we have seen several once misunderstood micro-cap stocks finally gaining respect, which has contributed to our strong performance of late. Two recent examples show that our investments in these stocks increased by 500% and here we outline their progress from highly misunderstood to highly respected and potentially overbought.
Addus HomeCare (ADUS) – Addus provides assisted living and skilled home nursing services. You can rarely explain a misunderstood stock with a single concept because if it was that simple it would not be misunderstood. There are four intertwined parts to the Addus story and why investors had no confidence the company could succeed:
- A large portion of Addus’ business was linked with the State of Illinois, and there was a perception that the state would never pay the bills.
- Addus operated a nursing home business which had very low margins. Management was able to divest this business at a nice multiple, improved the company’s balance sheet and financial strength.
- Because of the two issues above, investors did not believe that Addus could deploy capital to buy other business, which they subsequently were in fact able to.
- Addus was plagued by operating inefficiencies which no one believed they could improve.
- Again management proved doubters wrong as it fixed these issues and increased profitably.
From the beginning Addus was a broken IPO, as the stock went public at $9.00 and immediately missed expectations, dropping to $3.00-$4.00 right out of the gate. We sat down with the entire management team, it was twelve people in their offices which may have set a new record, and we listened to them pounding the table about how they would fix the four issues above and practically beg for institutional sponsorship. We became one of the only institutional investors in Addus and were rewarded when the stock finally received the market’s respect and increased 500% from our initial purchase.
“We have seen several once misunderstood micro-cap stocks finally gaining respect, which has contributed to our strong performance of late.”
Virtus Investment Partners (VRTS)* is an asset management firm which uses a model of sub-advisors, each with a distinct specialty and brand. Like Addus, Virtus came to the market as a highly misunderstood company, in this instance in a reverse merger. The company was valued at $100 million despite having $20 billion under management. We were intrigued because at this level the market said Virtus was worth 0.5% of AUM versus 1.5%-2.5% norm for the industry. Doing our homework we found that another $10 billion AUM was soon to come onto the balance sheet as contracts expired. So a company that was already undervalued was in reality vastly undervalued as AUM was in fact $30 billion and not $20 billion. Investors woke up and finally gave Virtus its respect over the past year, as our initial investment increased by over 500%.
Q: Does The Volatility In The Bond Market Have An Impact On Smaller Companies?
A: As many investors know, intermediate-and long-term long bond prices declined significantly over the past several months as interest rates began to rise. The reason for the rise in interest rates is related to expectations regarding Federal Reserve policy. The only reason the Fed would taper or shift toward a higher interest rate policy is because the economy is improving. Thisshould bode well for smaller companies that are more economically sensitive. We recently completed a historical analysis of this relationship in a research paper you can find on our website: Take Away The Punch Bowl, Small Cap Stocks May Keep Drinking, Rate Hikes and Small Cap Stock Returns.
Q: Do You See Any Change In Correlation Among Small And Micro-Cap Stocks?*
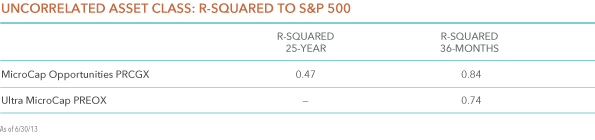
A: Over the life of our MicroCap Funds, the portfolios have experienced lower correlation to the overall stock market. The Perritt MicroCap Opportunity Fund’s R-squared measurement is 0.47 versus the S&P 500 Index over the twenty-five year life of the Fund. However, during the 2007 to 2011 timeframe, correlation increased significantly. We have noticed that correlation has starting to normalize toward a lower level over the past year. This is a positive because individual companies are once again starting to march to the beat of their own drummer, which implies fundamentals are working through to stock prices.
Performance as of 6/30/13*
The Perritt MicroCap Opportunity Fund’s R-squared measurement is 0.47 versus the S&P 500 Index over the twenty-five year life of the Fund.
Attribution Analysis
Click here for standardized fund performance.
Performance data quoted represents past performance; past performance does not guarantee future results. The investment return and principal value of an investment will fluctuate so that an investor’s shares, when redeemed, may be worth more or less than their original cost. Current performance of the fund may be lower or higher than the performance quoted. Performance data current to the most recent month end may be obtained by calling 1-800-331-8936. The funds impose a 2% redemption fee for shares held less than 90 days. Performance data quoted does not reflect the redemption fee. If reflected, total return would be reduced.
Micro Cap Opportunities Fund (PRCGX)
- The MicroCap Opportunities Fund gained 4.72% in the second quarter, outperforming the Russell 2000 Index (3.08%) but lagging the Russell MicroCap Index (5.10%). Year to date the Fund’s 19.54% return is higher than both indexes.
- Stock selection contributed to all of the positive returns relative to the indexes. Stock selection added 5.02% versus the Russell 2000 Index and 4.12% versus the Russell MicroCap Index. Stock selection in six of the Fund’s eight equity sectors added to relative outperformance.
- Stock selection was most pronounced in the health care, financials and consumer discretionary sectors.
- We continue to stress that our investors monitor the high level of exposure to financials in the Indexes. Financials now account for nearly 30% of the Russell MicroCap Index. Our underweight to financials added to the funds relative performance in the second quarter as financial names, notably REITS, struggled.
- Our biggest winners drove the returns, as the top five holdings provided 2.1% of portfolio return during the quarter. In aggregate, top five holdings have returned 118.3% year to date.
Ultra MicroCap Fund (PREOX)
- The Ultra MicroCap Fund gained 5.91% in the second quarter, versus 5.10% for the Russell Micro Cap Index.
- We always stress the difficulty of comparing this fund to a benchmark as it invests in companies far below the traditional radar, as demonstrated by its average market capitalization of just $59 Million (the lowest of all 8,012 equity Funds, according to Morningstar as of 7/26/13).
- Strong stock selection was concentrated in our top names, as the top five holdings contributed 3.5% to performance. Stock selection in five of the Fund’s eight equity sectors added to relative outperformance.
Manager Commentary, 1st Quarter 2013
Celebrating 25 Years
On April 11th, the Perritt MicroCap Opportunities Fund attained a 25-year track record. We are proud to be among a limited group of mutual fund managers – not to mention one of the only micro-cap managers – to have achieved such an established record of experience. We believe that we can keep improving if we make sure to always learn from our past experience. Departing from our typical commentary format, below is a look at select quotes over past three years and several outcomes which we can study to understand the strengths of our own analysis.
“I have not seen this degree of opportunities in both their range and depth over my twenty year career. Because of the damage to the confidence in our markets and in our economy, we believe that the recovery could last for many years and the rewards could be very impressive.”
—Manager Commentary, 3/31/2009
Results speak for themselves*, and we believe shareholders of the Perritt Funds have been rewarded considerably since the market bottom in March 2009. Equally impressive is the level of passion we witnessed from certain entrepreneurs and business owners who never seemed in doubt of their companies’ potential even during dire economic times. We may have learned more about human and investor psychology during this period than at any other time in our 25 years.
“We believe that the conditions facing the management teams of acquiring companies and those of companies targeted for pur-chase have created an environment for acquisition activity in the microcap universe where ‘the stars are aligned.”
—Manager Commentary, 3/31/2010
Merger & Acquisition (M&A) activity continues to be a major characteristic of micro-cap investing. Our outlook was initially accurate before M&A activity declined overall in 2011. Buy-out activity returned in 2012 due in part to anticipated changes in the tax code. Today we believe that we are in an environment where private equity firms and shareholder activists are hungry to get deals done.
“While short term periods where our investment style may be out of favor can be difficult, these periods have often provided us with the greatest opportunities”
—Manager Commentary, 6/30/2011
We added to our positions in a select group of securities during the summer of 2011 including Sanfilippo John B & Sons (JBSS), Midas (MDS), Global Cash Access (GCA) and Ruldolph Technologies (RTEC). Each of these companies were trading at very attractive valuations due partly to indiscriminate selling during the period. Our conviction was rewarded as each of the positions at least doubled since the investment.
The number one difference that we detect in the management teams between now and 2008-09 is what we describe as their ‘Cash Attitude.’ Simply put, management teams are no longer trying to survive, they are creating new ways to thrive.”
—Manager Commentary, 12/31/2010
A great example of Cash Attitude is Landec (LNDC), which used their excess cash and even new debt to make several strong accretive acquisitions. Landec, which has a legacy business of food packaging and distribution to grocery stores on the West Coast, has now partnered with food growers to build an expansive new greenhouse which produces many of the very foods the company packages. We recently visited the new Santa Monica, CA facility and were blown away by its size and scope; the site includes 64 acres of greenhouses, or 3 million sq. feet, equivalent to the size of fifty football fields. The market has loved Landec’s transactions as the stock has more than doubled since management’s announcement that they were using cash to invest in the business. You can hear more about our opinion of Landec in our interview with TheStreet.com on 2/1/13 (thestreet.com/video/11829793/bet-big-on-century-casinos landec.html – copy and paste link in your web browser to view).
“Investors who wish to participate in improvements in the U.S. economy may wish to look to small/micro-caps with more domestically-driven revenue sources as they seek to take advantage of U.S. improvements.”
—Manager Commentary, 3/31/2012
We are of the opinion there is no better way to get domestic revenue exposure than through a small, regional bank. Bank of the Internet (BOFI) is a distinct, niche company in that it provides banking and financial services online and without any brick and mortar locations. BOFI was a strong contributor to the performance both Funds, climbing 92% last year and another 29% in the first quarter of 2013. While it is true that the world is getting “flat” or more global, a significant portionof micro-cap revenue has continued to be domestically-based, which has been a benefit for investors in the current environment.
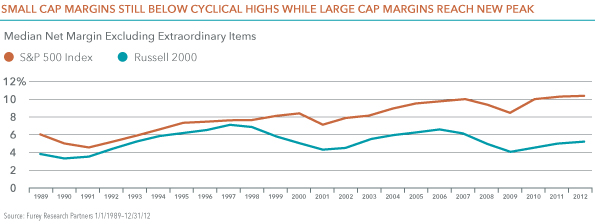
“It seems to be a common belief that margin expansion is at its peak. However, this is not always true in the types of small, niche businesses that possess more nimble pricing power than their larger, more diversified peers .”
—Manager Commentary, 6/30/2012
Corporate profits have been at record highs*, prompting many investors to wonder if decreasing margins pose an imminent risk to equity inventors. While this might be true for The S&P 500, we caution investors to realize that margin levels for small companies are nowhere near as elevated as what is seen in large cap companies, as seen in the chart on page one. Small companies are more likely to invest into growing their businesses, which has the potential to keep margins low. If a “margin-bubble” does in fact exist, we don’t see this risk among small cap companies.
Attribution Analysis
Click here for standardized fund performance.
Performance data quoted represents past performance; past performance does not guarantee future results. The investment return and principal value of an investment will fluctuate so that an investor’s shares, when redeemed, may be worth more or less than their original cost. Current performance of the fund may be lower or higher than the performance quoted. Performance data current to the most recent month end may be obtained by calling 1-800-331-8936. The funds impose a 2% redemption fee for shares held less than 90 days. Performance data quoted does not reflect the redemption fee. If reflected, total return would be reduced.
MicroCap Opportunities Fund (PRCGX)
- The MicroCap Opportunities Fund gained 14.15% in the first quarter, outperforming both the Russell 2000 Index (12.39%) and the Russell MicroCap Index (12.58%)
- Stock selection contributed to all of the positive returns relative to the indexes. Stock selection added 4.97% verses the Russell 2000 Index and 6.90% versus the Russell MicroCap Index. Stock selection in six of the Fund’s eight equity sectors added to relative outperformance.
- Continuing last ear’s trends, stock selection was most pronounced in the Health Care and Financials sectors. Strong selection in these sectors more than made up for a relative underweight versus the index, which detracted from performance.
- In aggregate, investments in the Health Care sector returned 39.60% in large part due to a strong performance oftop-10 holding Addus HomeCare (ADUS), which was up 84.53% during the quarter.
- We continkue to stress that our investors monitor the high level of exposure to Financials in the Indexes. Financials now account for nearly 30% of the Russell MicroCap Index, a level that we don’t believe is sustainable over the long term.
Ultra MicroCap Fund (PREOX)
- The Ultra MicroCap Fund gained 12.16% in the first quarter, versus 12.58% for the Russell MicroCap Index.
- We always stress the difficulty of comparing this fund to a benchmark as it invests in companies far below the traditional radar, as demonstrated by its median market capitalization of just $57 Million (the lowest of all 8,130 equity Funds, according to Morningstar as of 4/18/13).
- Overall stock selection was strong, contributing 4.64% to relative performance. Stock selection by industry was mixed, as selection in four equity sectors added to relative performance while selection in four sectors detracted.
- In the sectors where we did experience dpositive stock selection, the magnitude was significant.Our selection in the Financials and Health Care industries accounted for 6.03% of relative out performeance, due to strong returns in several individual names.
- The primary reason why our positive stock selection did not translate into outperformance was a bombination of a large underweight in Financials, which continued its strong run, and poor returns in the Consumer Discretionary sector.
Manager Commentary, 4th Quarter 2012
Where’s the Breadth?
A Closer Analysis of a Strong Year for MicroCap
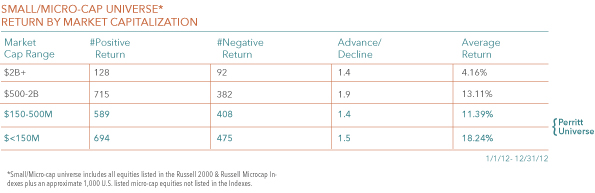
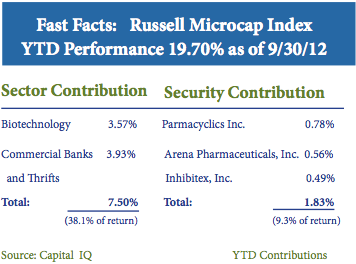
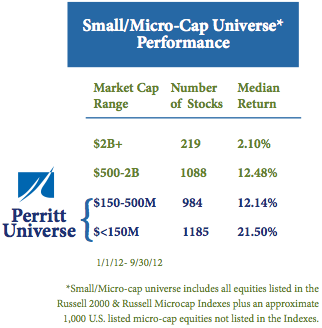
The year 2012 is now in the history books, and while returns in the small/micro-cap space were certainly a pleasurable read, we are also reminded of the old advice “don’t judge a book by its cover.” Despite our strong returns over the past year for both of The Perritt Funds, we believe that more opportunity may exist in our space. Valuations appear attractive, small businesses are growing, and an analysis of underlying index returns reveals how the small/micro-cap universe has not had the kind of broad-based run that has historically provided the best return environment for active managers. The 2012 return of the Russell Microcap Index was concentrated in a small number of sectors and securities, as we detailed in our last commentary. At year end, more than 35% of the Index’s return was due to the contribution of just two sectors: Biotechnology and Commercial Banks/Thrifts. The trend that a relatively small number of companies are driving the returns of the small/microcap space is more pronounced as you go down the market-cap scale. As shown in the table below, when we look beyond the Index and take a close analysis of our proprietary small cap universe, the advance/decline ratio was 1.5 or lower among companies with a market capitalization of $500 million and under. Historically, during a robust and healthy advance for micro-cap equities, this number has generally been much higher.
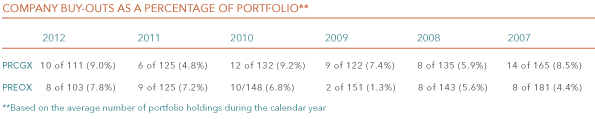
If we are to see the kind of improved breadth among micro-cap companies associated with a healthy advance, what will spark the investor confidence needed to get us there? One potential answer is the continued improvement of Cash Attitudes among management teams. We saw very healthy use of cash by companies in our portfolios at the end of 2012, although not in the way we predicted. More than 10% of companies in each of our Funds paid a special dividend at the end of last year.*
“…The small/micro-cap universe has yet to have the kind of broad-based run that has historically provided the best return environment for active managers.”
In fact, the Perritt MicroCap Opportunities Fund received 150% more dividend income during the last two months of the year than during the first ten months, primarily due to special dividends. Management teams decided to pay special dividends in large part because of the imminent tax increase on dividends (most of the companies we invest in have high insider ownership). Dividend payouts were also related to high levels of cash on balancesheets, which is a result of our process of investing in financially sound small companies.
The unparalleled payout of special dividends we saw last year is a shareholder-friendly action that we believe should bring positives to the capital structure of many micro-cap companies we invest in. First and foremost, small companies continue to improve their top and bottom lines. However, the excess cash held by many of the companies in our portfolio has driven down returns on equity, negatively affecting the P/E ratio investors are willing to pay. For example, RCM Technologies (RCM) is a company we own which has been in the $5.00-6.00 range while having $2.50 in cash per share. In December, RCM paid a special dividend of $1.00 per share, equal to one-sixth of its stock price, which will also increase the company’s ROE by a similar amount. With a lower shareholder equity number, the company’s future growth will show a greater improvement in ROE with less cash on hand. In the case of many micro-cap companies which fly so far under the traditional Wall Street radar, these kinds of actions can be the catalyst which sparks interest in the underlying business quality which has in fact been there all along.
We can’t finish without a mention that the Russell 2000 Index has reached a new all time high and a discussion of what this might mean for small/micro-cap investors. In our view this is again related to the issue of breadth. That the Russell 2000 Index hasreached new highs despite the fact that returns have been concentrated in a small number of names indicates that there may be opportunity for a more broad-based advance. Having avoided the ‘fiscal cliff ’ and with tax changes now settled, many management teams that we have met with are saying that uncertainly is declining, allowing them to better plan and execute their growth strategy. Smaller company stocks tend to demonstrate serial correlation, meaning that strong performance has historically been followed by periods of similarly strong performance. We will outline serial correlation in a new research paper later in the first quarter.

“The unparalleled payout of special dividends we saw last year is a shareholder-friendly action that will bring positives to the capital structure of many micro-cap companies we invest in.”
Attribution Analysis
Click here for standardized fund performance.
Performance data quoted represents past performance; past performance does not guarantee future results. The investment return and principal value of an investment will fluctuate so that an investor’s shares, when redeemed, may be worth more or less than their original cost. Current performance of the fund may be lower or higher than the performance quoted. Performance data current to the most recent month end may be obtained by calling 1-800-331-8936. The funds impose a 2% redemption fee for shares held less than 90 days. Performance data quoted does not reflect the redemption fee. If reflected, total return would be reduced.
MicroCap Opportunities Fund (PRCGX)
- The MicroCap Opportunities Fund gained 2.78% versus 1.85% for Russell 2000 Index and 0.04% for the Russell MicroCap Index during the fourth quarter. For the year the Fund returned 16.87% versus 16.35% and 19.74% for the Indexes, respectively.
- Stock selection was strong for the year, contributing 5.82% to relative returns versus the Russell 2000 Index and 4.12% versus the Russell MicroCap Index. Six of the Fund’s nine equity sectors added to relative performance (one sector, Telecom, had no impact).
- Stock selection was most pronounced in the Health Care and Financials sectors. Returns in the Health Care sector were driven by a nearly 100% return in top 5 holding BioScrip (BIOS). Financials returns were strong across the board, with over 75% of Financials holdings contributing to absolute returns.
- Despite the fact that Financials names we did invest in worked well, overall strength in the Financial sector overall detracted from our relative performance due to our significant underweight relative to the Index. Nearly 30% of the Russell MicroCap Index is now allocated to Financials. As discussed previously, more than 35% of the return of the Russell Microcap Index was concentrated in a small number of Biotech, Regional and Thrift Banking and stocks.
Ultra MicroCap Fund (PREOX)
- The Ultra MicroCap Fund gained 1.91% versus 0.04% for the Russell MicroCap Index during the second quarter. The Fund returned 11.79% for the year versus 19.70% for the Index.
- We always stress the difficulty of comparing this fund to a benchmark as it invests in companies far below the traditional radar, as demonstrated by its median market capitalization of just $50 Million (the lowest of all 8,163 equity Funds, accord-ing to Morningstar as of 1/28/12)
- Overall stock selection was positive, contributing 3.45% to relative performance for the year. The best performing investment was John B Sanfilippo & Son’s (JBSS), maker of Fisher Nuts. After trading at 0.1 times sales and 0.5 times book value earlier in the year JBSS began to gain traction after price increases took hold and margins expanded. We continue to be long term investors in JBSS and remain confident in this management team.
-
Stock selection gains were outweighed by negative contribution from holdings in the Technology and Materials sectors, both in terms of stock selection and sector allocation. Our relative overweight in Technology companies demonstrates our conviction in the strong upside opportunities currently found in more cyclical industries, especially in the sub-$50 million market cap range.
Manager Commentary, 3rd Quarter 2012
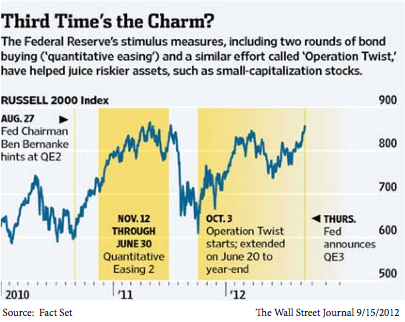
Q: How Might the Most Recent QE Announcement Affect Micro-cap Equities?
A: As most investors know, part of the underlying goal of continued QE is to push investors toward “riskier assets.” Measured by this metric, Bernanke has been somewhat successful despite the fact that investor assets have continued to pour into U.S. Treasuries. As seen in the table below, QE corresponds closely with positive returns for the Russell 2000 index. While QE continues it is reasonable to believe that this trend might persist, indicating a strong environment for small- and micro-cap companies.
An analysis of how small and micro-cap stocks respond to the rise and fall of inflation expectations provides us added valuable insight. These market-determined expectations have perhaps played a large role in investor behavior during the new, post-crisis/zero rate environment. We will be publishing a white paper early next month, Observations of Inflation Expectations’ Effect on Risk Assets in the Post-Crisis Period, analyzing the distinct periods of rising and falling inflation expectations over the past four years. We have found that since reaching the zero bound for interest rates the old ways of viewing inflation’s effect on stock prices has been turned upside down. In summary, higher inflation expectations have been good for risk assets generally and for small- and micro-cap stocks in particular. We believe that advisors and shareholders should continue to monitor investor expectations of inflation closely when measuring opportunity in the small and micro-cap sector. We certainly recommend all of our clients take a look at the white paper when it is released and we encourage your thoughts and feedback.
We will be publishing a white paper, Observations of Inflation Expectations Effect on Risk Assets inthe Post-Crisis Period, which demonstrates that since reaching the zero bound for interest rates, the old ways of viewing inflation’s effect on stock prices has been turned upside down.
Q: With Financials And Biotech Continuing To Drive Index Returns, Why Do You Remain Confident In Cyclical Companies?
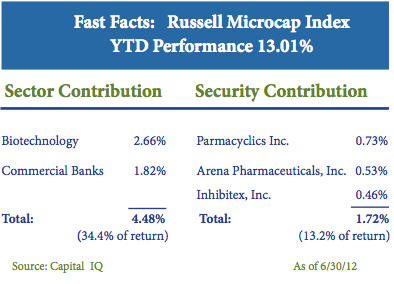
A: As we detailed in our previous commentary, the return of the Russell Microcap Index has been concentrated in a small number of Biotech, Regional and Thrift Banking stocks. This trend continued in the third quarter, as can be seen in the table below. Despite this, we are significantly underweight the Financials and Healthcare sectors be- cause of our strong conviction that the greatest upside opportunity in the micro-cap space can currently be found in cyclical companies.
“We believe that the low upside offered by financials is far less compelling than the earnings-power opportunities we see in cyclical companies today.”
To take a closer look at the level of upside potential found in typical cyclical company in our portfolio we point to Integrated Silicon Solutions (ISSI). This company produces semi-conductors for high-margin, customizable electronics products. Annual revenue is $265 million, the firm holds $100 million in cash with no debt on the balance sheet, and the market capitalization is $248 as of 9/30/12. Like many cyclical investments in the small- and micro-cap space, investors have shown no interest in business growth and fundamentals and have failed to do their homework to understand the story. ISSI has been lumped in with more commoditized chip manufactures despite its move towards high margin, more customized products and applications, a classic example of the baby being thrown out with the bath water. What we believe investors will eventually realize is the fact that ISSI trades at a P/E of 6.2 after netting out cash. To demonstrate the potential upside, ISSI would be priced in the mid $20 range based on forward earnings of $1.00, a 19.8% ROE and cash on the balance sheet.
Attribution Analysis
Click here for standardized fund performance.
Performance data quoted represents past performance; past performance does not guarantee future results. The investment return and principal value of an investment will fluctuate so that an investor’s shares, when redeemed, may be worth more or less than their original cost. Current performance of the fund may be lower or higher than the performance quoted. Performance data current to the most recent month end may be obtained by calling 1-800-331-8936. The funds impose a 2% redemption fee for shares held less than 90 days. Performance data quoted does not reflect the redemption fee. If reflected, total return would be reduced.
- The MicroCap Opportunities Fund gained 3.99% versus 5.25% for Russell 2000 Index and 5.92% for the Russell MicroCap Index during the second quarter. YTD the fund is up 13.70% versus 14.23% and 19.70% for the Indexes, respectively.
- Strength in both the Financial and Healthcare sectors detracted from our relative performance due to our significant underweight to those two industries as discussed previously. Nearly 40% of the return of the Russell Microcap Index YTD has been concentrated in a small number of Biotech, Regional and Thrift Banking and stocks
- Stock selection in total attributed 4.63% to relative returns versus the Russell 2000 Index YTD and 4.45% for the quarter. Relative to the Russell Microcap Index selection attributed 1.21% YTD and 2.5% for the quarter. Seven of the Fund’s nine equity sectors attributed positive stock selection, including strong selection in both the Financials and Healthcare sectors which were in fact the top two sector contributors based on stock selection.
- The Ultra MicroCap Fund gained 0.96% versus 5.92% for the Russell MicroCap Index during the second quarter. YTD the fund is up 9.70% versus 19.70% for the Index.
- We stress again the difficulty of contrasting this fund to a benchmark as it invests in companies far below the traditional radar, as demonstrated by its average market capitalization of just $50.6 Million (the lowest of all 8,145 domestic equity Funds, according to Morningstar as of 10/23/12)
- Like the MicroCap Opportunities Fund, the Ultra MicroCap Fund’s overweight to cyclical industries such as technology and energy detracted from relative performance.
- Relative performance impact was mixed as five of the Funds ten equity sectors contributed positively to performance. However, negative contributions from Energy, Healthcare and Materials outweighed gains achieved elsewhere.
Manager Commentary, 2nd Quarter 2012
Opportunity Now: Reasons For Small Company Optimism
Our clients understand that micro-cap equity is an asset class where active managers can provide great value. The lack of traditional Wall Street Analyst coverage leads to price inefficiencies and potential trading advantages that don’t always exist in the more closely-followed sectors. Yet as of the end of June, from what we have seen, active management in the micro-cap space appears to have lagged. As seen, micro-cap benchmark returns have been concentrated in a small number of Biotech and Regional Banking firms where many active managers (including ourselves) don’t observe compelling tradeoff between risk and reward.
In times like today, it is sometimes too easy to become swallowed by negative news and prevailing pessimism about the economy. Yet we consider ourselves fortunate to have the ability to meet with 3-5 management teams of small companies every week inside our offices. The perspectives we have gained from these on-the-ground entrepreneurs is often much different from what you read in the headlines. Here we pass along some of the opportunities we are uncovering during our analysis and meetings with company management. If you read closely you will find that in the Small/Micro-cap universe the facts counter many common misperceptions. ”
Micro-cap benchmark returns have been concentrated in a small number of Biotech and Regional Banking firms where many active managers (including ourselves) don’t observe a compelling trade-off between risk and reward”
High Margin Levels Unsustainable
Opportunity: Pricing Power Lets Many Small Companies Continue Margin Expansion
It seems to be a common belief that margin expansion is at its peak. However, this is not always true in the types of small, niche businesses that possess more nimble pricing power than their larger, more diversified peers. The decline of input costs related to falling commodity prices is another often overlooked part of the peak margin story. For example, John B. San Filippo & Son (JBSS) (maker of Fisher Nuts) consistently raised prices during a recent cycle where raw nut prices were steadily increasing. Roughly speaking, in a typical period where JBSS’s revenue was growing at 5%, prices were increasing by 10% while sales were down 5%. Knowing that this is a cyclical business, we were pleased when our investment thesis was proven correct and positive sales growth returned. Today, JBSS’s business is growing and nut prices are beginning to come down. Yet those higher prices the company set will be sticky, helping to potentially increase margins. Despite increasing over 100% this year, we continue to believe JBSS has upside potential; even after the substantial increase in share price JBSS is still trading below book value*.
“We applaud the many companies in our portfolio who are driving capital allocation in the right direction.”
Attribution Analysis
As discussed earlier, much of the micro-cap Index performance this year has been driven by concentrated returns in a small number of Biotech and Regional Banking firms. In our MicroCap Opportunities Fund, Healthcare (which includes Biotechnology) was the largest sector detractor from performance, contributing -1.50% to relative performance. In addition, our portfolios are currently invested with a cyclical bias in energy, technology, and industrial companies. This is wholly a result of our bottom-up analysis and our conviction that the greatest upside opportunity in micro-cap space can currently be found in cyclical companies. However, more cyclical investments have suffered due to a general flight to liquidity most of this year. Along with the aforementioned Healthcare sector, three of the top four sector detractors to performance were in fact Energy, Technology, and Industrials.
Stock selection has had a greater positive impact on the Ultra MicroCap Funds’ performance than seen in the MicroCap Opportunities Fund this year. This is not surprisingly considering we are investing in companies which are so far off the traditional radar; the current median market capitalization is approximately $50 million. One of our top performing holdings, U.S. Home Systems (USHS), provides customized kitchen and bathroom remodeling for Home Depot customers. USHS increased nearly threefold in a matter of two months on what was essentially market speculation about the recovery in U.S. housing. This type of “irrational buying” demonstrates the potential upside of investing in less liquid securities that many investors may overlook when focusing only on the risk to the downside of investing in micro-cap companies. Having experienced this type of short- term investor behavior many times before, we reduced our position by half before the stock returned to more normalized prices. USHS’s business is still growing and at today’s more modest price we believe that future earnings could equal a P/E in the mid single-digits.
Manager Commentary, 1st Quarter 2012
Three Years Later: Investor Sentiment Still Timid
You would not believe that investor confidence has returned if you only paid attention to the headlines. News of troubles in the Eurozone, a potentially slowing Chinese economy and partisan bickering in the U.S. have all contributed to a very pessimistic attitude among equity investors. Yet stock prices tell a much brighter story, as seen in the performance table below. Our MicroCap Funds have returned nearly 30% annually over the last three years since the market lows and overall equity markets, as measured by the S&P 500 Index, have approximately doubled during the same period. What investors fail to realize is that equity markets have typically climbed a “wall of worry” and that in terms of stock prices the headwinds in the news today are largely a thing of the past. We remain confident in the future of small/micro-cap equities based on our conversations with management teams, who are much more optimistic than headlines might have you believe. Companies are reporting strong corporate profits, cash flows are rising, and management teams are strategically deploying cash by increasing dividends, buying back shares, or making accretive acquisitions. In fact, this “cash attitude” thesis we have spoken about previously was confirmed by the world’s largest company, Apple (AAPL), which recently declared a dividend and outlined other plans to deploy cash.
“Companies are reporting strong corporate profits, cash flows are rising, and management teams are strategically deploying cash by increasing dividends, buying back shares, or making accretive acquisitions.”
Click here for standardized fund performance.
Performance data quoted represents past performance; past performance does not guarantee future results. The investment return and principal value of an investment will fluctuate so that an investor’s shares, when redeemed, may be worth more or less than their original cost. Current performance of the fund may be lower or higher than the performance quoted. Performance data current to the most recent month end may be obtained by calling 1-800-331-8936. The funds impose a 2% redemption fee for shares held less than 90 days. Performance data quoted does not reflect the redemption fee. If reflected, total return would be reduced.
According to the Investment Company Institute, investors have placed nearly one trillion dollars (net) into bond funds while taking nearly five hundred billion dollars out of domestic equity funds during the past six years. This massive flow from equity funds into bond funds is not surprising given that investors have experienced volatile equity markets with little return (specifically in large-cap equities) during the past ten years*.
The flows are not only from individual investors but also institutional investors such as pension funds. In fact, according to pension consulting firm Millman, assets into equities dropped to 38% in 2011 from 44% in 2010; while fixed income climbed to nearly 42% from 36% in the same time period. It may get even worse. Neil Schloss, VP and Treasurer of Ford Motors (F) was quoted at a recent conference saying, “we’re about 45% bonds today and over time we will move to a target of about 80% bonds.”
Equity markets have performed well despite a relentless outflow of cash due to several reasons including strong corporate profits, the fact that companies are purchasing back their own shares and the simple law of supply and demand. While the “demand” for equities is declining as seen in the patterns of inflows and outflows, the “supply” has actually decreased at the same time. The number of stocks publicly traded and the amount of shares available to investors has significantly declined over the past ten years. According to The Frank Russell Company, the number of investable stocks has declined by 40% since 1999. In 1999 there were nearly 6,000 domestic companies listed on major exchanges, as compared to just 3,566 today. If investors return to equity markets in any magnitude, a simple law of economics would suggest that the shrinking supply of companies to invest in could have a strong impact on rising prices.
How is your portfolio is positioned today compared to ten years ago?
We build portfolios from the bottom up based on a fundamental analysis of financial statements and in-person meetings with company management teams, so we do not make macro calls. However, a look at how our portfolios are structured does provide an understanding of where we are finding the most attractive valuations.
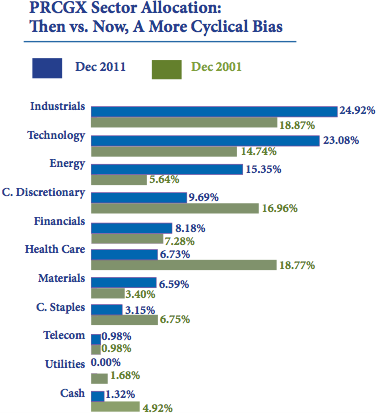
There is a greater allocation to cyclical companies in our portfolios today as compared to ten years ago. As you can see in the accompanying table*, just 10% of our portfolios are invested in defensive sectors such as consumer staples, health care, utilities or cash. Ten years ago this number was over 30%. This demonstrates our outlook that the business cycle is on the mend and that more economically sensitive small companies are beginning to thrive. While our cyclical bias detracted from performance somewhat in 2011, the top three sector contributors to performance in 2012 are technology, energy and industrials.
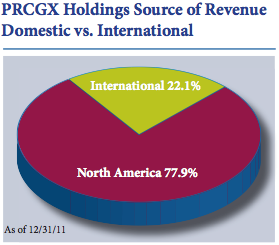
Sales of U.S. small/microcap companies are generally less global than that of large companies. According to Standard & Poor’s most recent analysis*, S&P 500 companies posted 46.3% of their sales from outside of the United States in 2010. By contrast, over three-quarters of revenues for companies in the Perritt MicroCap opportunities Fund were from North America. While some international economies appear to be faltering – notably the Eurozone where unemployment hit a 15 year high in February – there has been visible strength in the U.S. economy according to major indicators. The February University of Michigan consumer confidence and Institute of Supply Management service index reached their highest point in one year, the initial jobless claims 4 week average is at its lowest point since March 2008, and vehicle sales recorded the best month since May 2008 (excluding the cash for clunkers month of August 2009). Investors who wish to participate in im- provements in the U.S. economy may wish to look to small/micro-caps with more domestically-driven revenue sources as they seek to take advantage of U.S. improvements.
“Investors who wish to participate in improvements in the U.S. economy may wish to look to small/micro-caps with more domestically-driven revenue sources as they seek to take advantage of U.S. improvements.”
While some international economies appear to be faltering – notably the Eurozone where unemployment hit a 15 year high in February – there has been visible strength in the U.S. economy according to major indicators. The February University of Michigan consumer confidence and Institute of Supply Management service index reached their highest point in one year, the initial jobless claims 4 week average is at its lowest point since March 2008, and vehicle sales recorded the best month since May 2008 (excluding the cash for clunkers month of August 2009). Investors who wish to participate in improvements in the U.S. economy may wish to look to small/micro-caps with more domestically-driven revenue sources as they seek to take advantage of U.S. improvements. First quarter outperformance for the MicroCap Opportunities Fund was largely a result of stock selection and our cyclical bias. The top sector contributors included Technology (added 4.2% to performance), Energy (2.9%) and Industrials (2.9%). Because the microcap space is so vast, the active returns investors can earn are much more likely to come from stock selection as opposed to sector bets. That said, microcap stocks in sectors which the market is favoring can experience the catalyst which transforms them from an unknown to a Wall Street darling in an instant. For example, Global Cash Access (GCA), one of our top performing holdings, increased over 75% for the quarter after finally being recognized by analysts on Wall Street. Recent trading volume in GCA is four or five times greater than when we first began purchasing it. Despite the 75% increase in price, as of 3/31/12 the stock traded at only ten times earnings today, demonstrating how undervalued it was before other investors caught on. As we often like to do once volume picks up and price increases rapidly, we have reduced our risk by taking some profits off the table.
All of the outperformance by the Emerging Opportunities fund during the first quarter was due to stock selection. This is often the case when investing in companies with a median market capitalization of approximately $60 million which are so far off the traditional radar. We had some of our best success investing in technology stocks, which contributed 4.2% to the Fund’s performance as a sector. One of our top performing holdings, Innodata (INOD), is a business specializing in e-reader and e-book technology. The company helped Amazon develop the Kindle and has now been brought on to help Apple develop the e-reading technology in the iPad. INOD has no analyst coverage despite earning over $100 million in revenue and a healthy backlog of clients.
Manager Commentary, 4th Quarter 2011
Cash Value
What CEO’s of Small Businesses Are Doing Now to Enhance Shareholder Value
Don’t let headline market returns fool you; in the small and micro-cap space, shareholder value is being enhanced. Increased uncertainty and a rush to liquidity led to a disappointing year for micro-cap investors in 2011. However, the noise that is driving investor behavior such as political inaction and partisan bickering is short-term in nature. We are much more interested in analyzing the attitudes of the CEO’s of small businesses that we speak to in our offices every day. These attitudes reflect the true nature of long-term trends in our economy.
The number one difference that we detect in the management teams between now and 2008-09 is what we describe as their “Cash Attitude.” Simply put, management teams are no longer trying to survive, they are creating new ways to thrive. A few years ago, the top concern for most management teams was ensuring that they had enough cash in the bank to survive a difficult recession. Today, management teams are utilizing their cash and balance sheets to expand their businesses and enhance shareholder value in a variety of ways.
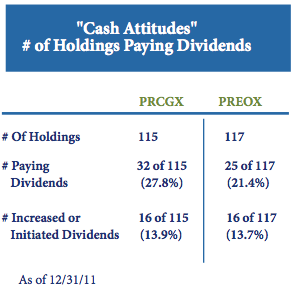
As you know, shareholder value comes in many forms. In addition to bottom-line growth, companies can increase shareholder value by initiating or increasing cash dividends. As can be seen in the accompanying table, nearly one-third of the holdings in the MicroCap Opportunities Fund pay a dividend and nearly 15% increased or initiated a dividend in 2011. Another way companies can enhance shareholder value is by buying back their own company’s stock. Although you’re not as likely to hear about it in the media, small-cap companies are often better positioned than their large-cap peers to buy-back their own shares. There are several companies within our portfolios that continue to buy back their own shares at levels they consider undervalued. For example, AEP Industries (AEPI) repurchased approximately $20 million worth of its shares in a privately negotiated deal in June of last year (nearly 15% of the company’s market cap at that time). We were pleased that management acted on their conviction that the company’s share-price did not accurately reflect shareholder value.
“Simply put, management teams are no longer trying to survive, they are creating new ways to thrive”
Finally, shareholder value can be enhanced by acquiring other companies. With ultra-low interest rates and depressed stock prices, it can make greater economic sense to buy a company rather than build it. Lately, we have seen management teams acquire companies that are not only synergistic but are also imm ediately accretive to their current business. For example, Glo-becomm System (GCOM) acquired Comm Source, Inc. in April 2011. Using cash to buy a profitable company that is delivering current earnings was immediately accretive to Globecomm’s financials.
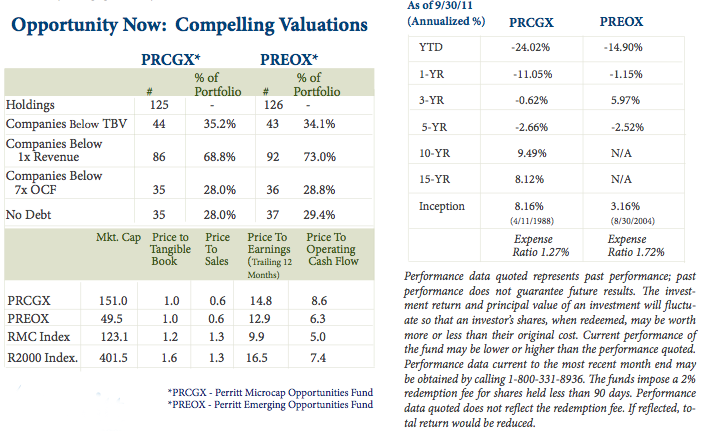
Valuations
Regarding valuations, the small/microcap universe is attractively priced based on several characteristics, as seen in the accompanying table*. The most talked-about measure, the price-to-earnings ratio, appears the least attractive. However, we en- courage investors to take a closer look at price-to-sales and price-to-book value, which are very compelling. We believe these two characteristics indicate that there is substantial cash flow and/or earnings power that can soon reach the bottom line.

Despite a contraction in valuation multiples, micro-cap equities have been growing cash flows, book values and overall shareholder value over the past few years. Perhaps more importantly, the “cash attitudes” of management teams indicate that there is a robust period of growth underway for well-run micro-cap companies currently being unrecognized by the market. As is often the case, micro-cap stock prices have been slow to respond due in part to their under-followed and under-researched nature. We believe this is a short term phenomenon and that shareholder value will ultimately be recognized with higher stock prices.
In 2011, sector allocation contributed more to The MicroCap Opportunities Fund’s under performance than stock selection. Nearly half of the Fund’s under performance was due to our significant overweight to the Energy and Industrials sectors relative to the benchmark. As we have noted before, much of the under performance in more cyclical sectors was due to a general flight to liquidity as investors abandoned micro-cap stocks during the year. Selling was often focused on the more volatile Energy, Industrials and Technology spaces, and on our lower market caps names in particular.
Regarding stock selection, our largest detractor during the year was within the consumer discretionary segment (Furniture Brands (FBN), Kimball International (KBALB) and CPI Corp (CPY) are examples). We are confident that, over time, investors will realize that these undiscovered companies are in fact trading at very attractive levels relative to their strong underlying fundamentals. Some recovery has already been realized in 2011: although CPY is no longer in the portfolio, FBN and KBALB are up 18% and 23%, respectively, this year (as of 1/25/12). It is important to note that individual stock selection within the energy sector contributed more positive return to the portfolio than did our selection within any other industry. This demonstrates the high level of opportunity that exists in the Energy space, despite the fact that many Energy names struggled to find recognition in 2011. In the micro-cap space, the best Energy opportunities tend to be found in service companies. Two of the portfolio’s top five contributors in 2011 were energy related companies: TGC Industries (TGE) and Newpark Resources (NR).
Under performance in Technology and Consumer Discretionary sectors detracted from The Emerging Opportunities Fund’s relative return in 2011. With a median market capitalization of just $50 Million, the investments in the Perritt Emerging Opportunities’ portfolio tend to be off the radar for traditional Wall Street analysts, helping these companies to move independently of the market. According to Morningstar, the Fund’s r-squared of 66.32 vs. the S&P 500 Index is the lowest of over 8,000 long-only U.S. Mutual Funds, as of 1/25/12.
Manager Commentary, 3rd Quarter 2011
Numbers Don’t Lie: A Disappointing Quarter, Compelling Opportunity?
If we believe that numbers don’t lie, then our words shouldn’t either: we are disappointed with our recent performance. Yet cold, hard numbers can teach us a lot, especially in an environment being dominated by emotion. In this commentary we will keep the words short and focus on the data. What can it tell us about the recent downturn? And where is the opportunity?
The extreme volatility in the microcap space was caused by a rush to liquidity by investors of all kinds. Fearful investors shunned the stocks that were less likely to be able to provide them with short term cash and they placed a premium valuation on more liquid, defensive names. The result was that poor performance has been most pronounced in the lower marketcap stocks, as seen in the adjacent table. Because we invest primarily in the sub-$500 million market cap range, the companies that we invest in were adversely affected.
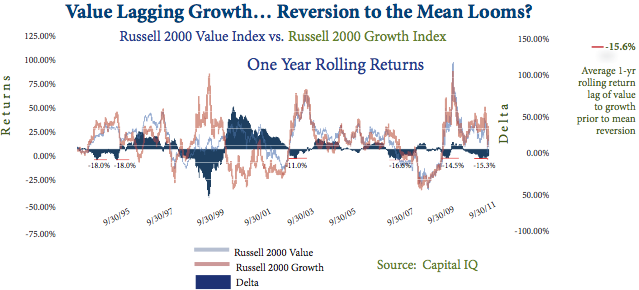
Value stocks have lagged growth stocks in the small-cap space this year, although this trend has been slightly reversing. In the past twenty years, The Russell 2000 Value Index has lagged the Russell 2000 Growth Index in seven distinct periods outside of the Technology Boom of the late 90’s, which can be viewed as somewhat of an anomaly. In each of the seven periods, the Value Index lagged the Growth Index by an average of 15.6% on a one-year basis before a predicable reversion to the mean occurred. In April of this year, the one-year return of the Value index lagged the Growth Index by 15.8%. As expected, since that time small-cap value stocks have outperformed. We tend to invest with an emphasis on solid fundamentals and clean balance sheets and we prefer to not pay for a price-to-earnings growth (PEG) ratio of over 1.0 for a growing company. Because of this, the relative outperformance of growth stocks has hurt our portfolio on a year-to-date and one-year basis, although it is encouraging that this trend is slightly reversing as might be expected.
Short Term Volatility… Long Term Track Record
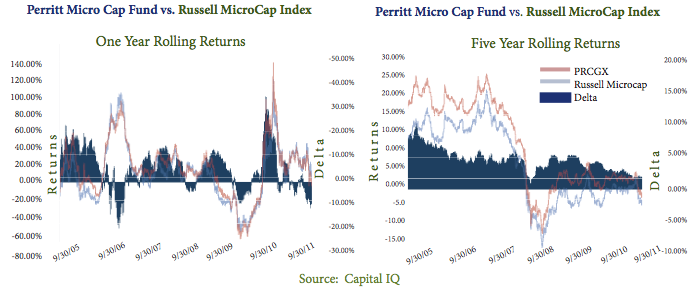
We know that the best way to measure performance is over a full market cycle. Despite being disappointed with our recent short-term performance, we do remember that we have been here before. We are confident about the future because our five-year rolling returns (shown below)* confirm that our shareholders have profited relative to the Index despite short term volatility.
Our twenty years of experience investing over multiple market cycles has taught us that it is difficult – if not impossible – to predict the moment when a short-term trend in under-performance of a market segment or a skilled manager reverses itself. However, portfolio valuations have often provided a good forecast. Many of the stocks in our portfolio have been a victim of indiscriminate selling regardless of balance sheet fundamentals or business performance. We hope that the valuation data and examples that follow will give you an insight into the earnings power and upside opportunity in our portfolios that are currently being ignored by Wall Street.
During the third quarter both the sector allocation and the stock selection hurt the performance of the Microcap Opportunities Fund. Much of the under performance was due to our significant underweight in Financials relative to the benchmark*.
The Fund has historically been significantly underweight in Financials and we expect that trend will continue as the number of high-quality financial companies in the micro-cap space is limited. However, despite our large underweight to the sector, we have lately increased our allocation to Financials as we have seen several attractively priced and compelling opportunities in the sector lately, mainly in asset managers and some regional banks.
Year-to-date, over half of the MicroCap Opportunities Fund’s relative under performance was due to our selection in the Technology sector. As explained in the beginning of this commentary, much of this had to do with a general flight to liquidity as investors abandoned micro-cap stocks. There was a large amount of selling focused on the more volatile Technology space, and on our lower market caps names in particular. We remain convinced about the long-term prospects of many micro-cap companies in the technology space because the strength of balance sheets in relation to stock prices is as attractive as we have seen in many years.
Stock selection was the reason that The Emerging Opportunities Fund outperformed its benchmark in the quarter as well as on a year-to-date basis. The Fund was driven by outperformance in stocks of nearly every sector. Selection was particularly strong in the Health Care sector, aided by the buy-out of two companies (American Medical Alert Corp. and Allied Healthcare International) at a significant return. Whether lucky or good, we are well-aware the kinds of “nano-cap” companies we invest in do march to the beat of their own drum and that making short-term comparisons to a benchmark can be something of a ridiculous exercise. As our clients know, we have good reason to believe this Fund is a truly distinctive offering which gives investors exposure to the very smallest of the small companies.
Manager Commentary, 2nd Quarter 2011
“Risk On, Risk Off”
The Misunderstanding of Business Risk And Why Inefficiency Reigns in the Micro-Cap Space
You don’t need your boutique and “undiscovered” micro-cap manager to tell you this, because you are probably hearing it everywhere. What we can tell you is that in the past six months the stock prices of some of the companies in our portfolio have suffered as a result. We feel these movements are short term in nature and do not greatly interfere with our 3 to 5 year investment outlook.
What we have seen is that investors are currently dismissing a number of micro-cap stocks as “risky” without having a complete understanding of the underlying businesses, and this has led to more pricing inefficiencies in the micro-cap space today.
As our shareholders know, we look for undiscovered companies that are not followed by Wall Street analysts. Stocks get ignored by Wall Street for a long list of reasons that includes a market capitalization that is deemed too small, a stock that is considered a “fallen angel,” or the fact that a company simply has no history or expectation of profitability. One area where we are finding what in our opinion are undiscovered and misunderstood companies today is what we call “cross-over stories.”
A cross-over story is a company that has a cash cow business and is using those profits to feed another business that has accelerating growth rates.
Click here for standardized fund performance.
Performance data quoted represents past performance; past performance does not guarantee future results. The investment return and principal value of an investment will fluctuate so that an investor’s shares, when redeemed, may be worth more or less than their original cost. Current performance of the fund may be lower or higher than the performance quoted. Performance data current to the most recent month end may be obtained by calling 1-800-331-8936. The funds impose a 2% redemption fee for shares held less than 90 days. Performance data quoted does not reflect the redemption fee. If reflected, total return would be reduced.
A quick look at the financial statements or an automated screen of a cross-over story may give you a false impression of the underlying business. The cash cow portion of the business may be stagnant or have declining margins. Analysis focused on this portion of business may justify a lower valuation, and in the current environment may lead an investor to deem the business as “risky.” This misunderstanding of risk is precisely where we believe that the opportunity arises.
We seek to understand a company based on the entire picture because we make the effort to dig deeper and to meet with company management. Our analysis is often focused on the cross-over portion of the business, because our experience leads us to believe that this overlooked segment should drive earnings over the next 3 to 5 years. For example:
Rentrak (RENT)
Rentrak has been in the business of supplying VHS and DVDs to Mom & Pop video stores across the country for more than a decade. However, the rise of streaming video and other video-delivery options has caused this business to decline. Aware of this trend, Rentrak management diversified their business into demographic data tracking. Rentrak is now the leading provider of real-time audience data to marketing businesses. Rentrak’s crossover story is that its video-supplying business is feeding the higher growth rate and higher margin data-tracking business. We see this data-tracking segment becoming the majority of the company’s business in the future, a fact that we believe is being missed by Wall Street.
- Rentrak has been stuck in the range of approximately $100 million in revenue for multiple years.
- Revenue from the legacy business decreased in excess of 30%
- New data tracking revenue has grown from zero to in excess of $30 million.
- Margins in the data tracking business significantly higher than legacy business.
- As the company crosses over to the higher growth and higher margin data tracking business, earnings should accelerate to several dollars a share, equating to a single-digit P/E.
Landec(LNDC)
Landec has a legacy business of food packaging and distri-bution to grocery stores on the west coast. The company has developed a new line of business based on technology that extends the shelf-life of food, mainly bananas and avocados. Landec’s crossover story is that its food distribution business is feeding what could soon be a multi-million dollar recurring business with higher margins. This high growth/high margin business is being overlooked because it currently represents less than 20% of the firm’s business. However, we believe that the Breathway® segment could soon provide a major portion Landec’s overall revenue, possibly making the stock deeply undervalued to future earnings.
- Landec’s transition into the new business leads us to believe that the company can potentially possess an earnings power of $1.00, which equals a P/E in the single-digits.
“As our shareholders know, when a misunderstood company has received recognition historically the upside has been fast and significant”
Investors’ current aversion to risk has led to a significant amount of pricing inefficiencies in the micro-cap space and within our own Portfolios. In the short term this has affected performance, but we continue to have a strong conviction in our portfolios. As our shareholders know, when a misunderstood company has received recognition historically the upside has been fast and significant.
A crucial issue in determining when an under followed investment may gain recognition is the catalyst. This is something that we cannot be sure of. It could be growth rates that help micro-cap stocks gain the Street’s attention – small company growth rates could be 1.5-2 times the growth rates of larger companies, potentially helping small companies get into favor. But we just don’t know. Ultimately we are long term investors and we will continue to look for pricing inefficiencies in the micro-cap space, a task which has been getting a bit easier of late.
Small-Cap Market Overview
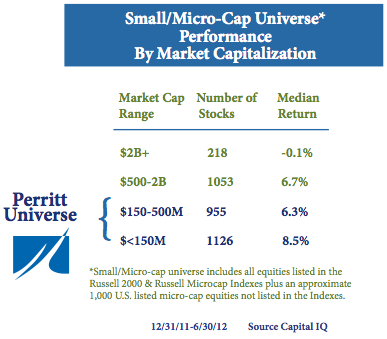
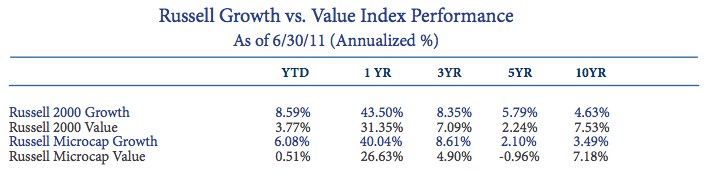
As we noted in our last commentary, larger market-cap names have been out-performing this year. This trend continued into the second quarter, with the largest names in the Russell 2000 Index providing a median return of 8.8%, as compared to -7.4% and -2.8% for companies under $150 MM and in the $150-$500 MM range, respectively, which is where we tend to invest.
This year the market has also favored growth over value, as the Russell Microcap Growth Index has provided investors with a 6.08% return YTD as compared to 0.51% for the Russell Microcap Value Index.

We invest with a long-term horizon because we understand the cyclical nature of the market. While short term periods where our investment style may be out of favor can be difficult, these periods have often provided us with the greatest opportunities, as described in this commentary. We believe that the true measure of a manager is over the full market cycle, and in our opinion our Portfolios are well-positioned to achieve another profitable run.
Manager Commentary, 1st Quarter 2011
Q: Despite a lack of coverage in mainstream media, the Russell 2000 recently hit a new all time high. What is your outlook?
A: The Russell 2000 hit a new all time high on April 27, 2011, closing at 858.31, above the mark of 855.77 set on July 13, 2007. Both the S&P 500 Index and the Dow Jones Industrial Average still have yet to fully recover from the bear market of 2008-09. The Russell 2000 Index’s continued climb relative to the broader markets has prompted us to take a closer look at what has been driving the Index’s recent performance, and to understand what this might mean for investors.
Despite the recent leadership by the Russell 2000 Index, a closer look at market internals leads us to believe that we are actually in the middle of a small-cap correction.
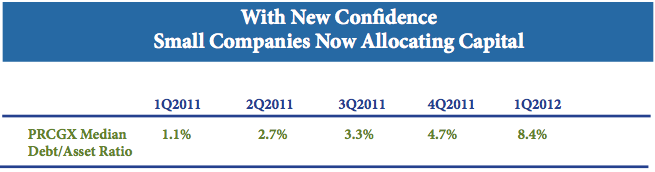
The Russell 2000 Index’s return has been driven by a small number of larger market-cap names. For the period of 12/21/10-4/12/11, the median return for companies with a market capitalization above $2 billion was 8.1%, as compared to just 1.1% for companies in the $150 million to $500 million market-cap range. Because the Russell 2000 Index is market-cap weighted, the stronger performance among larger names had an even greater effect on the Index’s overall return. Investors should be aware that the Russell 2000 Index will be rebalanced on June 24, 2011, as is performed annually. At that time, many of the larger stocks that have been driving the Index’s performance will be rotated out of the index in favor of smaller names. The correction can be observed in many of the true micro-cap names within the Russell 2000 Index that have in fact declined in price. In our opinion, much of these declines can be attributed to investors’ decisions to take profits, as many of the smallest names in the Index provided some of the strongest returns coming out of the down market.
Average Annualized Performance % as of 3/31/11*
Q: The MicroCap Opportunities Fund was up 6.27% for the quarter, yet the Fund saw its P/E ratios decline. How do you explain this apparent anomaly?
A: We believe that our ability to lower the P/E ratios in the portfolios during a strong period of positive returns demonstrates that we are still able to find value within our universe of micro-cap names. We are able to find value because of improving business fundamentals and the relative lagging performance of smaller names within the Russell 2000 Index, as discussed previously.
The decline in P/E ratios is two-fold: we rotated out of several more expensive names into more modestly priced equities and we also saw a broad increase in company earnings
The most interesting part of the decline in P/E ratios is that on a weighted average basis this trend is amplified. As you can see in the table below, the weighted average P/E ratio of the Fund declined significantly within the last quarter. This demonstrates that we have focused portfolio assets among more value-oriented equities. For example, in the MicroCap Opportunities Fund we recently sold Vasco Data Security (VDSI), a company trading at 40x earnings, and purchased two companies, Global Cash Access (GCA) and Intersections (INTX), which are both trading close to 10x earnings.
Russell 2000 Index Performance by Market Capitalization 12/31/10-4/12/11*
Q: What trends are you discovering regarding dividends within the small company universe?
A: Smaller companies are certainly not known to pay out a significant amount of dividends. However, lately more small companies are both initiating dividends as well as increasing dividends. In The Microcap Opportunities Fund there are 28 companies that pay out dividends. Eight of these have actually increased their dividends over the quarter. In The Emerging Opportunities Fund 16 companies pay out dividends. Five of these sixteen have recently increased dividends. Companies are also taking other actions in deploying their cash such as buying other businesses or buying back their own stock. Each of these trends has been significant in our portfolio and in the small-cap market as a whole. In our opinion, the fact that companies are finally using their cash instead of holding onto it demonstrates that they are no longer afraid of near-term problems with the overall economy. This gives us confidence that management teams should continue to take actions that will ultimately increase shareholder value.
Median and Dollar Weighted P/E ratios 12/31/10-3/31/11*
Lynn Burmeister, IACCP®
Matthew Brackmann, CFA®
Dianne Click
David Maglich
Interest Rate Hikes and Small-Cap Stock Returns
Interest Rate Hikes and Small-Cap Stock Returns
Regardless of the macro factor influences, investors are always concerned about future returns. One of those concerns is the impact on stock prices once the Federal Reserve starts raising short-term interest rates. While we certainly agree that many recessions happen after the Fed raises rates too much, it may interest investors how small-cap returns perform.
While exact dates and periods of past tapering actions or interpretations of “Fed speak” can’t be measured precisely, we can look at past periods of interest rate hikes and their impact on small-cap equity returns. From this data, investors may gain some historic context to enhance their perspective regarding Fed actions and stock returns.
The previous six times the Federal Reserve embarked on raising interest rates and the performance of small returns are listed below:
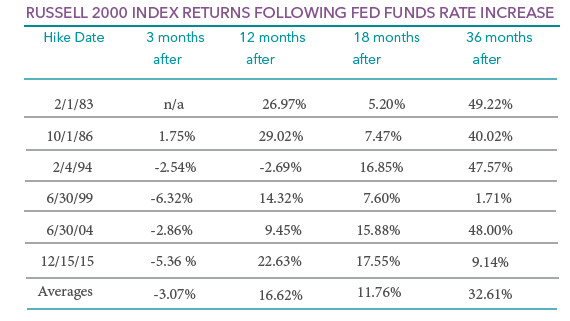
During the each of the last six instances, small-cap returns have provided positive average returns during the 12, 18 and 36-month periods following Fed tightening. Notably, small-cap stocks generally performed very strongly for the first twelve months following a rate hike, followed by a pull back during the ensuring six-month period. This indicates that, historically, if there is a time for concern regarding small-cap returns in relation to Fed actions, that time is typically twelve months following a rate hike. Lastly, it could be argued that the 12 to 18-month period could be a buying opportunity too. The 36-month return after an initial rate is remarkably strong.
The Micro-Cap Advantage: How MicroCap Equities Have Helped Enhance Return and Lower Correlation in Client Portfolios
The Micro-Cap Advantage
Ever since stock markets were created, investors have been devising schemes to enable them to beat the market’s average return. Some invest in large companies, some invest in small companies, and others ignore company size and invest in companies of any size as long as they have potential to produce market-topping returns. Some investors buy-and-hold while others trade frenetically. Some invest in high multiple growth stocks while others prefer to shop among companies whose stocks have recently been beaten down. Then there are the technical analysts and those who analyze only economic fundamentals. Some investors assemble portfolios from “the top down” while others prefer a “bottom up” approach.
Academics have long admonished investors for spending so much time trying to predict the future. They point to the plethora of studies that indicate the stock market is a reasonably efficient mechanism. In an efficient market, the best guess at tomorrow’s stock price is today’s price. The existence of numerous buyers and sellers and the near instantaneous flow of new information cause securities to be priced according to their inherent risk. Most academics will tell you the only way to produce market-topping long-term investment returns is to build and maintain a highly diversified portfolio that contains more systematic risk than the stock market as a whole. In short, what investors ultimately get from their equity portfolios is paid for by the risks they take.
The Small Firm Effect
The first formidable crack in the so-called efficient market theory appeared in the late 1970s when a University of Chicago doctoral student discovered a strategy that has produced superior investment returns for more than 80 years. Superior meaning that this strategy has historically produced greater returns than dictated by portfolio risk. This strategy has come to be known as “the small firm effect.”
Simply put, the small firm effect is the tendency of the common stocks of small firms to outperform the common stocks of large firms given the same level of risk. In an efficient market, the expected rate of return from any portfolio is directly related to its non-diversifiable risk. The greater the level of non-diversifiable risk, the greater the expected rate of return. Contemporary research, however, indicates that this has not been the case for well-diversified portfolios consisting of small firm common stocks.
The small firm effect was first measured in 1978 by Rolf Banz while completing his doctoral dissertation at the University of Chicago. Banz ranked NYSE-listed stocks by market capitalization and formed five portfolios containing the largest to smallest stocks listed on the Exchange. These portfolios were held for five years and then the stocks were re-ranked and new portfolios were formed. He repeated the process throughout the period 1925 through 1975. Next, he measured the monthly returns of each portfolio and applied a least squares regression analysis to those returns to obtain each portfolio’s beta (measure of relative systematic risk) and alpha (the portfolio’s average monthly risk-adjusted return). He expected portfolios with larger amounts of systematic risk to produce larger investment returns than portfolios with smaller amounts of systematic risk. What he found was a return anomaly that has yet to be fully explained.
- Over the 50-year period studied, the first four portfolios (those containing all but the smallest NYSE firms) provided investors with investment returns dictated by the risk of the portfolio, indicating these portfolios were efficiently priced. (Actually, these four portfolios provided investors with an average risk-adjusted monthly return of -0.06 percent per month (alpha), or -0.72 percent per year, less than they should have given the amount of systematic risk they contained.) These portfolios, if anything, were slightly overvalued by the market during this period.
- On the other hand, the portfolio containing the smallest NYSE companies provided investors with a risk-adjusted excess rate of return of 0.44 percent per month (alpha), or nearly 6 percent per year.
Since Banz investigated the risk/return behavior of only NYSE-listed stocks, he was mute regarding the universality of the small firm effect. However, Professors Thomas Cook and Michael Rozeff of the University of Iowa examined the nature of firm size and investment returns using stocks listed on the NYSE, the AMEX and those traded over-the-counter over the period 1968-1978. They ranked 3,130 stocks on the basis of market capitalization and divided them into 10 portfolios containing an equal number of stocks
- The four portfolios containing the stocks with the lowest market values provided monthly returns of 0.14 to 0.45 percent after adjustment for risk.
- The remaining six portfolios (containing larger company stocks) all possessed negative monthly alphas ranging from -0.01 percent to -0.35 percent.
Thus, the market undervalued small firm stocks during this period and overvalued large firm stocks. The annualized risk adjusted returns for the portfolios of the smallest and largest firms revealed a wide distribution, ranging from 5.4 percent for the decile 10 portfolio (smallest companies) to -4.2 percent for the decile 1 portfolio (largest companies).
During the last three decades, many researchers who doubted the existence of a small firm effect have subjected stocks of small and large firms to numerous tests using various statistical techniques. All confirm its existence, although its explanation continues to be a subject of ongoing debate.
The Small Firm Effect: A Rationale
Whatever the explanation of the small firm effect, it is not because firms are small. Firm size is most likely just a proxy for one or more factors, which highly correlate with firm size. For example, David Dreman popularized the notion that lower valuation multiple stocks tend to outperform higher valuation multiple stocks. It could be that firm size is a proxy for the low P-E ratio effect. However, recent research indicates the reverse – that the P-E anomaly is actually a proxy for the small firm effect.
An examination of the characteristics of small versus large firms reveals striking differences:
- First, the micro-cap segment of the U.S. equities markets is very small. The aggregate market capitalization of the entire micro-cap universe is approximately $309 billion. Of this amount, about $103 billion is in the hands of company founders and their families. That leaves about $206 billion available for the investing public. To put this number in perspective, it is only 35% of the market value of Apple Inc.
- Furthermore, the median market capitalization of stocks in the micro-cap universe is about $301 million. Because of limited liquidity (the average daily trading volume of most micro-caps is usually measured in thousands of shares rather than the millions of shares traded daily for large-cap stocks), it is difficult to buy and sell a large number of shares of micro-cap stocks without significantly impacting share price. As a result, large institutional investors tend to shy away from this sector of the market. The absence of a significant player in this segment of the market could very easily distort the risk/ return characteristics of individual stocks.
Because institutional investors tend to shy away from micro-cap stocks, it is not surprising to find that very few analysts keep tabs on their activities. In the early 1980’s, Professors Avner Arbel and Paul Strebel authored a study entitled “The Neglected and Small Firm Effects.” In this study, the authors tested the notion that the stocks of less researched companies provide greater risk-adjusted returns than more researched companies. Their study of S&P 500 Index companies indicated the less the research concentration, the greater were risk-adjusted returns. When research concentration was coupled with firm size, the favorable risk-adjusted returns were magnified. While small firms outperformed large firms during the study period, under-researched small company stocks performed even better. In other words, the absence of analyst attention distorts the risk/return characteristics of small firm stocks.
- Another characteristic of small firm stocks is that a significant percentage of their outstanding shares are held by operating management. On average, about one-third of the outstanding shares of companies in the bottom 20 percent of NYSE listed companies (when ranked according to market capitalization) are held by operating management. The next 20 percent have less than 5 percent of their shares in the hands of operating managers. That has led some theorists to suspect that a possible explanation for the small firm effect is that the managers of small firms care about share price performance over the long run because they are such large shareholders themselves. The bulk of their wealth is determined by the price of the shares of stock of the companies they manage. In other words, the objective of outside investors and that of corporate insiders coincide (i.e., maximize the firm’s share price).
As pointed out earlier, the smaller the company the less liquid is its publicly traded stock. That means investors must pay a higher price or receive a lower price when selling large blocks of small firm stocks. As a result of the increased liquidity risk inherent in small stocks, investors may require a liquidity premium to invest in them. In other words, beta may not capture all of the risk inherent in small firm stocks, and the extra returns provided by small firm stocks may be nothing more than payment for liquidity risk. Of course, liquidity risk can be mitigated by those who invest in relatively small amounts of a company’s outstanding shares and those who hold their investments longer term.
- Finally, small firms tend to be under-diversified. While most large firms offer multiple product lines or services, small companies tend to be rather narrowly focused. Because of the lack of product diversification, small companies possess a higher degree of unsystematic risk than do large companies. While a high degree of unsystematic risk may be bothersome to company management, it can be diversified away by investors who maintain well diversified portfolios. On the other hand, large company diversification comes with attendant costs. Thus, it may well be that the superfluous diversification practiced by almost all large companies reduces investment returns more than investment risk. The result is a lower risk-adjusted return than is the case for portfolios that contain the stocks of smaller, more streamlined, firms.
Smaller Company Stocks Have Performed Best
Since 1983, Ibbotson & Associates has reported on the historical returns of various categories of assets. Their initial volume of the Stocks, Bonds, Bills and Inflation Yearbook traced the annual returns of stocks, bonds and Treasury bills back to 1926 and they have updated the monthly and annual returns for these categories ever since. As can be seen in Table 1, the compound annual return of small company stocks has surpassed that of large company stocks (defined as the total annual return of the Standard & Poor’s 500 Index) during this period. The 2.1 percent compound annual return differential favoring small company stocks is by no means a trivial amount. A hypothetical $1.00 investment in the S&P 500 Index made at the beginning of 1926 would have grown to $6,035 at the end of 2016, while a similar hypothetical $1 investment made in a portfolio of small firm stocks would have grown to $33,212. That’s over a five-fold advantage for smaller company stocks.
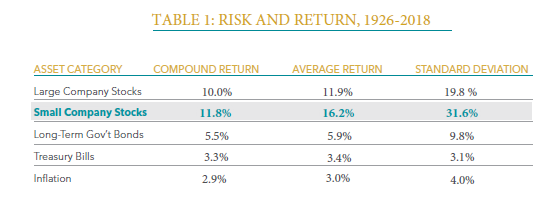
Small company stocks possess significantly more risk than do large firm stocks. Their annual standard deviation is nearly two-thirds larger than that of large firm stocks. Over relatively short periods of time, small company stock portfolios can experience significant losses. During 1937, the worst year ever for small firm stocks, they lost 58 percent of their value. Furthermore, during the five-year period ending in 1932, small company stocks declined by an average of 27.5 percent a year, representing a plunge of 80 percent. However, all seasoned investors know the potential for larger investment returns are invariably accompanied by larger investment risks.
While small company stocks have historically outperformed large company stocks over the long run, they may not do so during relatively short periods of time. During 34 of the last 89 years, for example, large company stocks provided larger returns than small company stocks. But even over relatively short time periods such as one-year, the odds of achieving over performance favor small firm stocks. That is, during the last 89 years, small company stocks topped the returns of large company stocks in 55 years or 62 percent of the time.
Table 2 lists the compound annual returns of four categories of investments by decade since the 1930’s. As can be seen, during three of the last seven decades, large company stock returns exceeded those of small companies. Although small company stocks performed exceptionally well during the decades of the 1980’s and 1990’s (average compound annual return in excess of 15 percent), large company stocks performed even better. However, that exceptional performance came to an abrupt halt in early 2000 when the air was let out of the internet/technology balloon. In fact, during the ten-year period ending 2010, small company stocks returned a cumulative total of 150.10 percent versus a cumulative 14.92 percent total return for the Standard & Poor’s 500 Index.
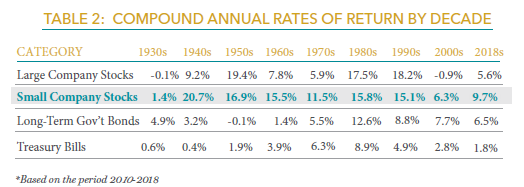
Although portfolios of small firm stocks are risky, their compound annual returns during each of the last seven decades have been positive. That is, had you invested in a diversified portfolio of small firm stocks on the first day of each decade and liquidated your investment on the last day of the decade you would never have experienced an investment loss. Furthermore, it is interesting to note that the average returns from Treasury bills did not top the average returns of small firm stocks during any of the last seven decades. In other words, while a small firm stock portfolio experiences significant volatility over short-term periods, some of that volatility can be mitigated by holding a small firm stock portfolio for a lengthy period of time.
Table 3 illustrates the cross correlations of annual returns for four investment categories. Note that the correlation between small and large company stocks is 0.79. That implies that while the returns of small-cap and large-cap stocks tend to move in similar directions, they do not do so in lockstep. In fact, the percentage of volatility in small-cap portfolio returns that is attributable to the volatility in the stock market as proxied by S&P 500 Index returns (R-squared) is 62 percent. That suggests that there are diversification benefits to combining portfolios of small firm stocks with portfolios of large firm stocks.
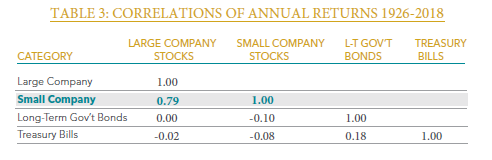
Using the standard deviations of small- and large-cap returns illustrated in Table 1 and the correlation coefficient illustrated in Table 3 we can estimate the historical beta for the small-cap portfolio. (This can be done by dividing the annual standard deviation of small-cap returns by the annual standard deviation of the S&P 500 Index returns and multiplying by the correlation coefficient.) This calculation produces a beta of 1.26 versus a beta of 1.00 for the S&P 500 Index. In other words, in standard deviation terms, small stocks are about 60 percent more risky than large stocks. However, they are only about 26 percent more risky in terms of beta risk. If you were to assemble a portfolio that contained one-third of your capital invested in small firm stocks and two-thirds invested in large firm stocks, the weighted average beta of your portfolio would be 1.09 (i.e., a 9.0 percent increase in beta risk versus an all large firm portfolio). However, that portfolio would have an average annual return potential of 13.6 percent. (This is done by multiplying the average annual return of large company stocks of 12.1% by 2/3, multiplying the average annual return of small company stocks of 16.7 by 1/3, and adding the sum). This is a 12.6 percent increase in return potential over the all large company portfolio return of 12.1%. Since return potential (12.6% increase) has increased more than the portfolio’s beta risk (9.09% increase), the portfolio’s risk per unit of return has actually decreased. This is a compelling reason to allocate a portion of any growth-oriented portfolio to small firm stocks.
Small-Cap versus Micro-Cap Stocks
Shortly after the publication of Banz’ seminal research, academics dubbed the extra risk-adjusted returns provided by small firm stocks “the small firm effect.” Small firms were defined as those of all public companies with market capitalizations below that of the company that separated the bottom 20 percent of NYSE-listed stocks from the remainder when ranked from largest to smallest on the basis of equity market value. However, that definition would not stand the test of time.
A dozen years after Banz’ stunning discovery, numerous professional investors sought to capitalize on the small firm anomaly. From a mere handful of small company mutual funds existing in the early 1980’s, the number of small firm mutual funds grew to nearly 100 by the mid 1990’s. However, mutual fund managers soon learned that managing small company assets is no easy task. As cash flowed into their portfolios, many funds were forced into making investments in the stocks of larger, more liquid companies.
- As a result, the small firm mutual fund category was broadened to include funds with average market capitalizations ranging from as little as $50 million to as much as $1 billion. To account for the huge range in average market caps, mutual fund data services coined a new term to separate funds with modest average market capitalizations from those with hefty market capitalizations. Thus, was born the micro-cap fund designation.
Using the definition in the original Banz Study (the bottom quintile or deciles 9 and 10), a small-cap firm today is one whose market capitalization falls below $549 million. However, these are now considered to be micro-cap stocks. In general, the small company designation is considered to be companies with market capitalizations ranging from $549 million to $2.5 billion.
The micro-cap universe contains the stocks of about 1,350 companies with an aggregate capitalization of about $309 billion. (The median market capitalization in the micro-cap sector of the market is approximately $333 million.)
- Although micro-cap stocks encompass more than one-half the number of companies whose stocks are nationally traded, they account for about 1.4 percent of the market’s total market value.
- On the other hand, the 185 largest nationally traded companies have an aggregate capitalization of about $14.8 trillion and account for about 64 percent of the aggregate market value of all publicly traded stocks. The largest publicly traded company, Apple, Inc., has a market capitalization of $591 billion, nearly twice the size of the market value of the entire micro-cap sector.
The arithmetic mean annual return for the smallest stocks (deciles 9 and 10) is significantly larger than that of the largest nationally traded stocks (deciles 1 and 2). The absolute difference in arithmetic mean return between decile 1 and decile 10 stocks is indeed impressive (20.6 percent versus 11.2 percent).
However, the true micro cap advantage lies in the fact that on a risk-adjusted basis, diversified portfolios of very small company stocks historically have provided returns that exceed those predicted by their relative systematic (beta) risk. Furthermore, the smaller a portfolio’s market capitalization the greater is the return premium.
- Research indicates that micro cap stocks, in aggregate, provide annual returns in excess of those predicted by the Capital Asset Pricing Model that average approximately 3.69%. In other words, portfolios of micro cap stocks have a high probability of producing a significant positive alpha.
The volatility of return in this sector may be more than most investors can tolerate. However, given the superior returns they have historically provided and the relatively low degree of correlation with other equities (most notably large company stocks), it can make solid investment sense to allocate a portion of all growth seeking investors’ portfolios to microcap stocks. The size of such an allocation is open to debate.
These academic findings illustrate the risk-adjusted excess return potential that exists in the micro-cap sector of the U.S. equity market. The “small firm effect” is the tendency of common stocks of small companies to outperform the common stocks of large companies given the same level of risk. Finally, the old investment axiom that investors only get from their portfolio what is paid for by the risks they take can be put to sleep. Here is an academic discovery that for 88 years has delivered returns greater than dictated by portfolio risk.
In Summary
Small company stocks topped the returns of large company stocks in 55 of the past 89 years, or approximately 62 percent of the time. There are several reasons why the small firm effect prevails in the equities market, and they should be considered when constructing a small stock portfolio:
- The micro-cap segment of the U.S. equities market is very small. Approximately $309 billion in micro-cap stocks are available for the investing public, an amount that is only 35% of the market value of Apple, Inc.
- Neglected asset class Less researched companies have proven to provide greater risk adjusted returns than more researched companies. In the absence of significant analyst attention, risk/reward characteristics for micro-cap stocks have become distorted.
- Shares held by company management On average, about one-third of the outstanding shares of micro-cap companies are held by operating management. The objective of outside investors and that of corporate insiders coincide, maximizing the firm’s share price.
- Liquidity risk and long term holding As a result of the increased liquidity risk inherent in small stocks, investors may require a liquidity premium to invest in them, and the extra returns provided may be nothing more than payment for liquidity risk. This can be mitigated by holding investments for a long period of time.
- Streamlined firms and portfolio diversification Smaller, more streamlined firms avoid the superfluous diversification practiced by large companies that reduces investment returns more than investment risk. The result is a higher risk-adjusted return for small stock portfolios, along with a high degree of unsystematic risk. While that risk may be bothersome to small company management, it can be diversified away by investors who maintain well-diversified portfolios.
History demonstrates that small companies have provided superior absolute and risk-adjusted returns compared to large companies over the same time period. The volatility of return in this sector may be more than most investors can tolerate, and small companies do not encompass a complete investment program for these investors. However, given the superior returns small company stocks have provided and their relatively low degree of correlation with other equities, including large company stocks, it can make solid investment sense to allocate a portion of all growth-seeking investors’ portfolios to small and micro-cap stocks.
Observations of Inflation Expectations’ Effect on Risk Assets in the Post-Crisis Period
Note From The Research Desk George Metrou, CFA, Director of Research
{Having reached the zero bound for interest rates, the old ways of viewing inflation’s effect on stock prices has been turned upside down. Higher inflation expectations have been good for risk assets generally and for small-and micro-cap stocks in particular in the recent period. Behavioral analysis tells us thatinvestor expectations of inflation should be as predictive as (or more than) realized inflation when measuring opportunity in the small and micro-cap sector.}
Observations of Inflation Expectations’ Effect on Risk Assets in the Post-Crisis Period
We assert that the current market environment, characterized by dis-inflationary trends sand short-term interest rates being at the zero-bound, has turned the conversation of inflation expectations effects upside down. Specifically we observe a high and positive correlation between rising inflation expectations and risk asset prices. We suggest that although these observations are associated with rising yield pressures, this dynamic has been and may continue to be, a positive catalyst for risk assets.
Inflation expectations represent the aggregate market expectation for future inflation. Understanding the level of inflation expectations is a key factor in helping policy makers determine monetary policy, which in turn aids policy makers in keeping long term inflation expectations anchored.
Inflation expectations can be measured from market-based information such as the term structure of interest rates, otherwise known as the yield curve. We also observe expectations imbedded in the spread between nominal and real bond yields (US treasuries minus Treasury Inflation-Protected Securities). Forecast-based expectations from market participant surveys and economists’ models can also be incorporated.
In the following analysis, we have chosen to observe a market based measure of inflation expectations calculated by measuring the spread between 10 year US treasuries (UST) and 2 year UST. We believe using market based signals provide anaccurate and less biased representation of the aggregate inflation expectations of market participants.
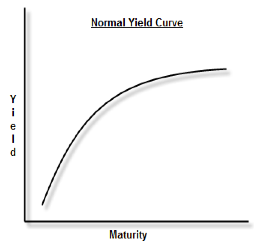
The course of the yield spread in the post-crisis period
Inflation expectations (as measured by our proxy, the yield spread of 10 year UST and 2 year UST), have been on a roller coaster ride in the current era of zero interest rates. In an attempt to limit the noise of normal market movements and identify true shifts in market participant expectations, we placed a threshold on spread shifts to discern a true shift in expectations. Our threshold defines periods of rising inflation expectations and declining inflation expectations as a minimum shift of 50 basis points (bps), or one-half percentage point, in the yield spread. Using this framework, the post-crises period has been marked by three distinct periods of both rising inflation expectations and declining inflation expectations.
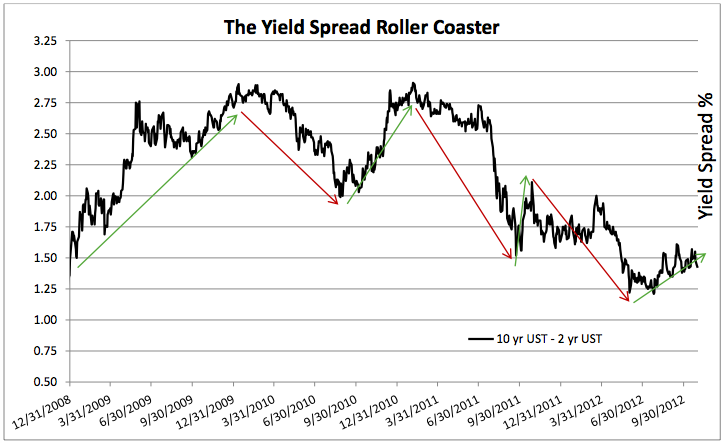
As seen above, the spread bottomed near 130bps in the final days of 2008, near the depths of market disruption. By early 2010, after rising for over a year, the yield spread had dramatically increased to a high of 290bps. A persistent decline followed, culminating with the spread bottoming near 200bps in August of 2010. The spread then surged into the spring of 2011, again reaching over 290bps. It remained elevated for a number of months prior to collapsing in the early fall of 2011. Note that this collapse occurred, a long with a great deal of financial market distress, around the time the US Congress staged a showdown over the debt ceiling. Resolution of that turmoil led to a brief and rapid rebound in the spread only to fall off again in the spring of 2012. Finally, in the summer of 2012 we observed a spread at the lowest point since the Federal Reserve lowered the target fed funds rate to zero. Below we define each of the three distinct periods of both rising spreads and falling spreads, including the length of each period and the respective averages.
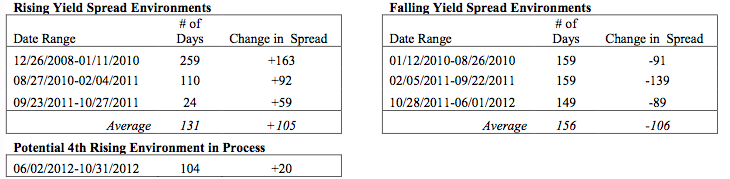
We believe that after bottoming early this past summer the spread has begun a fourth expansionary phase. In our estimation, the yield spread expansion is beginning from a compressed level. The recent lows reached 122bps, which is even below the lows of late 2008. For this reason, we suggest that the yield spread, representing inflationary expectations, may expand with greater duration and a greater magnitude than the average of the previous rising spread environments.
There is a high and positive correlation between risk asset performance and rising inflation expectations, as seen in the table below. US small cap equities returned on average 29.2% and were the best performing asset class. Following this, we observed average returns for the S&P 500 of 23.4%, commodities of 22.8%, and real estate assets of 18.5%. At present, the most recent environment of rising spreads has confirmed the relationship between higher inflation expectation and positive risk asset returns.
In the second table we can see the results that correlate with declining inflation expectations. When inflation expectations are falling all four risk asset classes perform decidedly worse.Commodities were affected the most declining an average of -11.8%, closely followed by the Russell 2000 (-10.0%) and the S&P 500 (- 7.7%). Real estate does show a marginally positive return in falling inflation expectation periods, but we point out that the return difference for real estate between the two environments is supportive of our thesis.
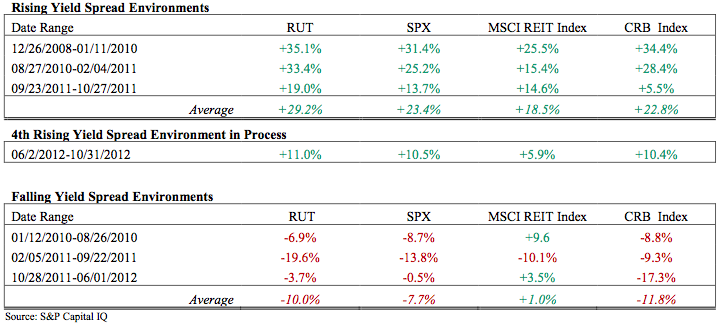
Beyond the correlation seen in the data above, our suggestion that risk assets are responding to rising inflation expectations also relies on our sense that it is a diminishing fear of the opposite, a deflationary outcome, which is motivating investors. Deflation has continued to loom following the disruption in financial markets, the economic recession, and even now during a sub-par recovery. This has been a primary concern among market participants and policy makers alike. These deflationary fears are supported by the fact the US has continued to experience repeated disinflationary trends despite the stimulative effects of monetary easing and fiscal support over the past four years.
Deflation and all of its detrimental effects (worsening economic output, corporate earnings, household finances, and asset prices) was well demonstrated in Irving Fisher’s 1933 paper on the subject, “ The Debt Deflation Theory of Great Depressions.” Increased inflation expectations result in less fear of deflation, which subsequently leads investors to anticipate higher nominal spending, higher nominal cash flows for corporations and a lower probability of deflationary shocks for a levered economy.
In our view, the reduction in risk of a deflationary scenario is the factor exerting the most impact on risk asset prices. It is with that view that we would also state that inflation is no panacea. We do not view wealth through a nominal lens. The drawing on the first page of this report, although a cartoon, represents a serious issue. We do not desire an inflationary moneyball to be shot at the markets. Although we have asserted that convention has been turned upside down with respect to the view of inflation, we are not stating any type of “this time it’s different” argument. We merely assert that given the present set of circumstances, rising inflation expectations are supportive of risk asset prices, particularly US small cap equities. Prior notions regarding inflation’s negative effects on equity prices are invalid given the current market landscape.
To test this, we ran the same inflation expectations analysis using nominal and real bond spreads, or “TIPS spreads,” for treasury bonds of equal tenor. This, in theory, isolates the inflation premium more clearly than that of a nominal yield spread between two different maturities. The results were virtually the same. TIPS spreads also show rising inflation expectation periods were positive for risk assets.
We choose to use our methodology over the TIPS spread for two reasons. First, we have seen some criticism in using the TIPS market indicator because of that market’s relative lack of liquidity compared to that of the UST market. Second, given that yields for TIPS have been low for years (and are outright negative today), it suggests a confirmation that the growth premium has been and is currently nil. Given that fact, we do not believe that we are conflating growth and inflation expectations when using the 10 year UST and 2 year UST spread. Furthermore, the circumstantial evidence of the timing of the shifts in the yield spread with expansions of the Federal Reserve’s balance sheet are too close for us to not suspect inflation expectations as the primary driver.
US Federal Reserve balance sheet activities
Since the onset of the crisis, the Federal Reserve Bank of the United States has engaged in numerous unconventional and controversial policies in an effort to combat the crisis and facilitate a faster recovery. Chief among these unconventional policies has been the Fed’s expansion of its balance sheet to purchase assets. Formally called Large-Scale Asset Purchase Programs, or LSAPs, the programs are commonly referred to as quantitative easing or QE for short. The Federal Reserve has previously engaged in two sets of outright purchase programs (QE 1 and QE 2), one term altering program (Operation Twist), and announced on September 13, 2012 the launch of a third LSAP program (QE 3). The table below illustrates the announcement dates, target securities and program sizes, duration, and average monthly purchase pace in the table below:
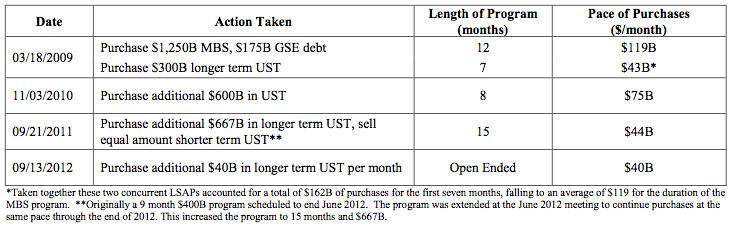
We do not intend to critique the actions of the central bank, argue for or against the efficacy of its programs, or to propose policy prescriptions of our own. We must observe the present situation and respond accordingly. With that said, it does not take much to notice that each of the separate periods of rising inflation expectations we identified began near the launch of each new LSAP. The only minor exception is the second period, corresponding to QE 2, where rising inflation expectations were ahead of the commencement of the program by roughly two months and closely coincided with Ben Bernanke’s 2010 Jackson Hole speech. It was in that speech he referred to the possibility of an additional round of asset purchases.
We admit we are aware of some strategists pointing out the diminishing effects of each successive round of QE. We agree with that assessment. However, we point out that it appears as though this has been a deliberate strategy of the Fed. This is possibly in light of their assessment of the benefits and risks of QE, as each successive program has seen a reduced pace of purchases on a monthly basis. With respect to the most recently announced round of asset purchases, QE 3, we expect inflation expectations, and in turn risk assets, to respond as they have during prior purchase programs. We may however, be wrong. We believe that is a reason the Fed made this third program open-ended, which is a dramatic departure from previous policy. An open-ended QE program gives the Fed the flexibility to scale up the pace of purchases (increasing the flow of the program) or run the program longer (increasing the total stock of purchases) than would a fixed size program. It is this characteristic of the latest round of asset purchases that gives us high confidence that it will affect inflation expectations and those expectations in turn affect risk assets positively.
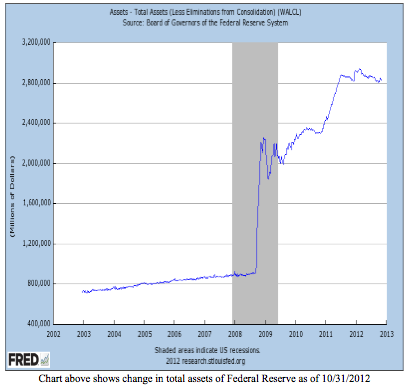
Lastly, and only slightly reneging on our attempt to avoid passing any judgment on the Fed’s actions, we again reference Fisher’s Debt-deflation Theory. Fisher wrote, “Unless some counteracting cause comes along to prevent the fall in the price level, such a depression as that of 1929-1933 (namely when the more the debtors pay the more they owe) tends to continue, going deeper, in a vicious spiral, for many years. There is then no tendency of the boat to stop tipping until it has capsized.” We argue the Fed’s policies are indeed the counteracting cause.
Ben Bernanke, in reference to comments he made in a 2003 speech titled, “Deflation: Making Sure ‘It’ Doesn’t Happen Here,” has at times been referred to as “helicopter-Ben.” The particular policy prescription he was suggesting to combat a deflationary liquidity trap that earned him this moniker involved the fiscal and monetary authorities working together to deploy a central bank financed tax cut. This type of policy was likened to a “helicopter drop” of money. We find this interesting, because in actuality Bernanke was only referencing, and specifically cited, the original contributor of this idea: Milton Friedman. Recently, in the Q&A following a speech at the Economic Club of Indiana, Bernanke suggested that Milton Freidman would have been supportive of the Fed’s current policies. Bernanke was lampooned in some corners of the financial media as though he had defamed Friedman’s character. Writing on his blog, Economist David Beckworth a professor at Western Kentucky University, pointed to a Q&A done by Friedman himself in 2000 in which he had the following exchange: David Laidler: Many commentators are claiming that…with short interest rates essentially at zero, monetary policy is as expansionary as it can get, but has had no stimulative effect on the economy. Do you have a view on this issue? Milton Friedman: Yes, indeed. … the situation is very clear. It’s very simple. They can buy long-term government securities, and they can keep buying them and providing high-powered money until the high powered money starts getting the economy in an expansion. What [the economy] needs is a more expansive domestic monetary policy.”
Conclusion: Judging the beauty contest
The market today is operating under a new set of rules. The extreme events over the past four years have pushed investors and policy makers to question their prior assumptions and attempt to find new tools to comprehend the current environment. In the past, investors relied on the assumption that rising inflation expectations would lead to yield pressures or rate hikes, which were seen as equity negative. We argue that today’s circumstances of a central bank holding short term rates at zero percent and a persistently disinflationary environment have turned that conventional thought upside down. Through analyzing the performance of various risk assets during three distinct periods of rising and falling inflation expectations, we have concluded that rising inflation expectations are positive for risk assets, US small cap equities in particular. We view a high possibility that we have recently entered a fourth period of rising inflation expectations and that this period will be prolonged.
It is at this point that we may be sometimes tempted to hesitate to follow our own research. What if the market is wrong? What if the Fed policies are more harmful than helpful? What if this happens? What if that happens?! We admit that we don’t know and we cannot predict the future. Yet our work is to identify the best course of action given the circumstances.
In times like these we are reminded to follow the advice of John Maynard Keynes, not, with all due respect, Benjamin Graham. Keynes said we should think of the market as a beauty contest, and we a member of the judges’ panel. The goal is not to decide for ourselves what we individually think beauty is, but only to be among the judges who pick the winning contestant. It is then we will be able to claim our great ability to detect true beauty. The wonderful thing about being a “panel judge” today is that we can look at prior contests and come to conclusions about what the other judges found beautiful. In our case, it is our judging duty to look at history and determine what the markets have deemed to be the highest beneficiary in certain environments, the prettiest asset.
Graham said the market was like a voting machine tabulating the results with each investor being a voter. Even being steadfast in the belief of the correctness of our vote, casting a lone vote, or even a losing vote, wins us no prize. If we were “voting” in the market, we may be tempted to cast a vote that incorporates our own biases, predispositions, or faulty assumptions.
The interesting aspect about thinking of the markets as a beauty contest is that it relies on the perception of the collective wisdom of the market to ascertain beauty. This is ironic because the markets, the life blood of free market capitalism and the central domain of individual risk takers, are indeed ruled by this collective wisdom. The results of the beauty contests we have watched over the past few years, when judged by the desirability of risk assets during periods of rising inflation expectations, have shown that the judges vote enthusiastically. And that the crown has gone to US small cap equities.
Addendum
Anticipating inquiries surrounding what the above analysis*, specifically the outperformance of equities during easing periods, may imply about the magnitude and duration of this bull market. A fear being that we have gone, “too far, too fast,” and the market is a product of little more than Fed manipulation. We present the following chart. If you would like to speak to our team regarding current and historical valuations, please contact us.
Sources:
1 Bernanke, Ben. “Monetary Policy since the Onset of the Crisis” speech delivered at the Federal Reserve Bank of Kansas City Economic Symposium, Jackson Hole, WY, August 21, 2010
2 Bernanke, Ben. “An Unwelcome Fall in Inflation” speech delivered to the Economics Roundtable, University of California, San Diego, La Jolla, CA, July 23, 2003
3 Federal Reserve System Monthly Report on Credit and Liquidity Programs and the Balance Sheet, August 2012. http://www.federalreserve.gov/monetarypolicy/files/monthlyclbsreport201208.pdf
4 Fisher, Irving. “The Debt Deflation Theory of Great Depressions,” Econometrica (March 1933) pg. 337-57.
5 Friedman, Milton. “Canada and Flexible Exchange Rates” keynote address delivered at the Bank of Canada Conference on Revisting the case for Flexible Exchange Rates, November 2000.
Active Microcap: A Private Equity Alternative – Acuitas Investments
Click at the bottom of this page to continue to the article.
The views expressed in this article are those of the authors as of the dates of the article. The opinions expressed are subject to change, are not guaranteed and are not intended as a forecast or as a recommendation to buy or sell any security.
Microcap investing and Private equity investing may have several inherent differences, including investment objectives, costs and expenses, liquidity, safety, guarantees or insurance, fluctuation of principal or return, and tax features. The differences depend on individual strategies as defined in prospectus. In general, Private Equity capital is not quoted on a public exchange and consists of investors and funds that make investments directly into private companies or conduct buyouts of public companies that result in a delisting of public equity. Capital for private equity is raised from retail and institutional investors, and can be used to fund new technologies, expand working capital within an owned company, make acquisitions, or to strengthen a balance sheet. The majority of private equity consists of institutional investors and accredited investors who can commit large sums of money for long periods of time. Private equity investments often demand long holding periods to allow for a turnaround of a distressed company or a liquidity event such as an IPO or sale to a public company.
Less-Liquid Holdings Could Mean More-Solid Results – Morningstar Advisor Magazine
Click at the bottom of this page to continue to the article
Less-Liquid Holdings Could Mean More-Solid Results.
The views expressed in this article are those of the authors as of the dates of the article. The opinions expressed are subject to change, are not guaranteed and are not intended as a forecast or as a recommendation to buy or sell any security.
Past performance does not guarantee future results. The data provided in this reprint is historical sector or index specific performance and is not indicative or predictive of any future returns. You may not invest directly in an index or sector. The historical returns provided are not representative of any Perritt Fund. Standardized performance for our funds can be obtained by clicking here.
The Truth About Small Caps and Rising Rates – Fidelity Investments
Click at the bottom of this page to continue to the article.
The views expressed in this article are those of the authors as of the dates of the article. The opinions expressed are subject to change, are not guaranteed and are not intended as a forecast or as a recommendation to buy or sell any security.
Past performance does not guarantee future results. The data provided in this reprint is historical sector or index specific performance and is not indicative or predictive of any future returns. You may not invest directly in an index. The historical returns provided are not representative of any Perritt Fund. Standardized performance for our funds can be obtained by clicking here.