

Investment Team
Michael Corbett
Michael Corbett
Deja vu All Over Again: Serial Correlation and Micro-Cap Equities
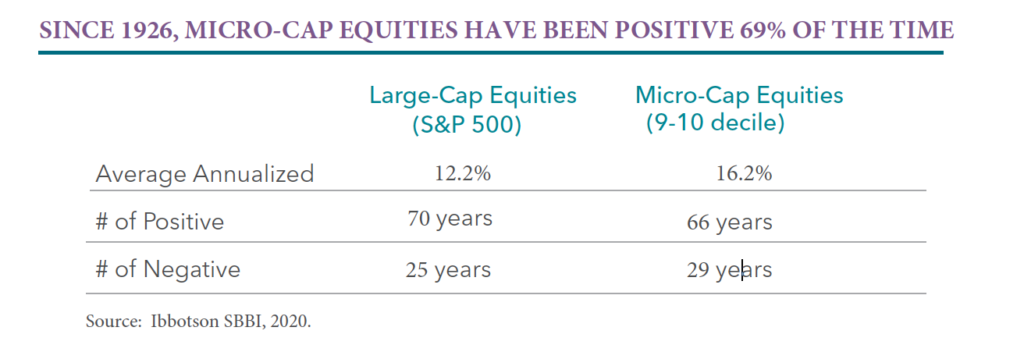
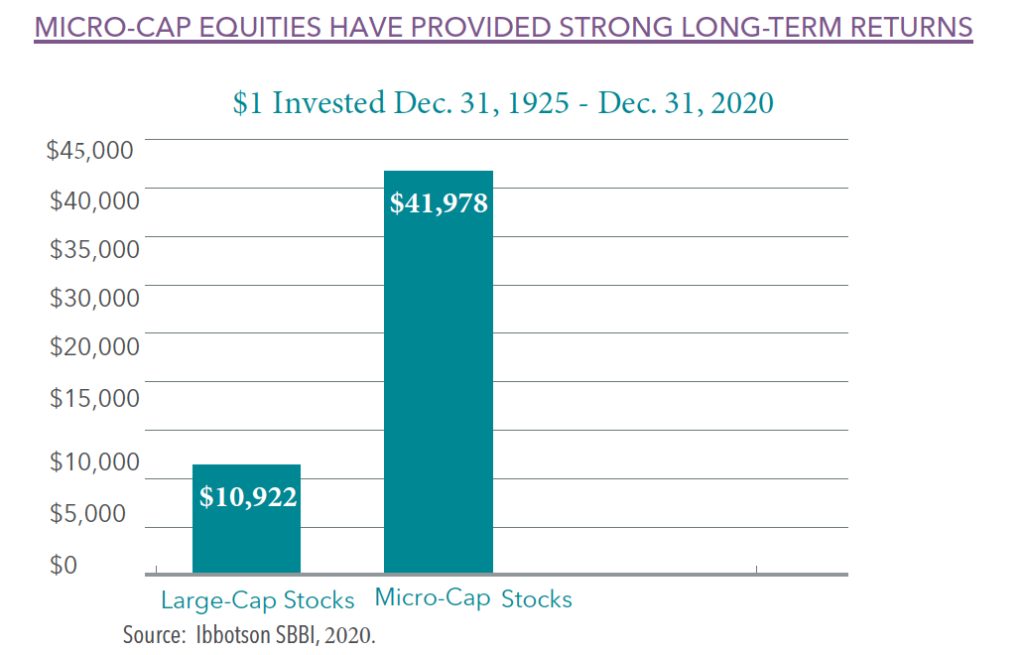
Experienced investors understand how compounded returns can have a significant effect on wealth creation. However it takes more than a little resolve to reap the full rewards of compounded returns, as equities have declined approximately 50% not once but twice in the past fifteen years. Despite these periods of steep decline, equities – particularly micro-cap equities – have provided patient investors with large rewards over the long term. Understanding historical trends in market returns might help investors gain the perspective needed to make investing for the long term an easier pill to swallow.
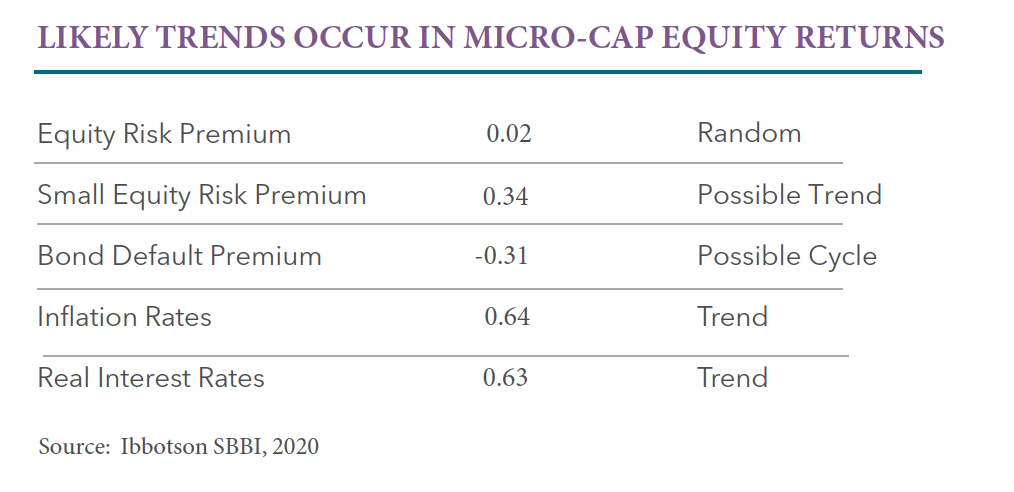
 Historical performance trends show that positive and negative returns tend to be grouped together. To understand if there are trends within stock performance, we turn to a statistic terms called serial correlation. The serial correlation of a return series describes the extent to which the return in one period is related to the return in the next period. A return series with a high (near one) serial correlation is very predictable from one period to the next, while one with a low (near zero) serial correlation is random and unpredictable. In the table below, we provide serial correlation for equities, bond defaults, inflation rates and real interest rates. The results show that large equities returns do not show predictive results, ie., their performance is purely random. However, while micro-cap equities returns are of course not purely predictive, there is a likely trend of serial correlation that has been observed within their historical performance.
We gathered 95 years of performance in micro-cap equities and grouped them into single-year and consecutive-years performance periods in the table below. (see methodology below*). We found that there were three times as many periods where micro-cap equities experienced a winning streak than period where positive returns lasted only one year.
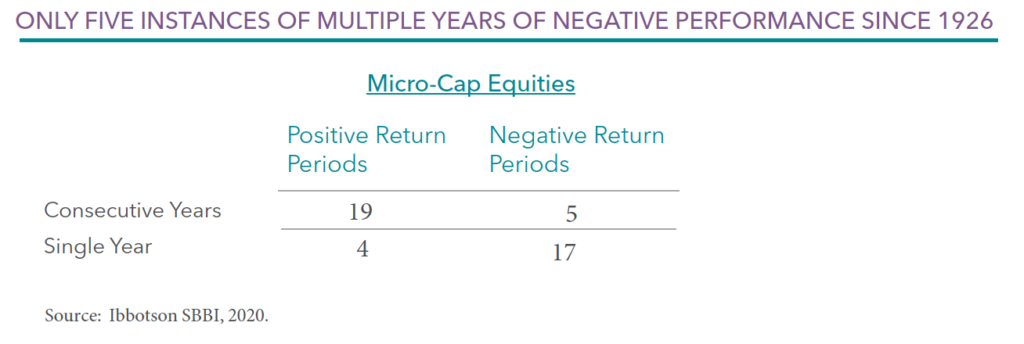
Overall the 45 periods analyzed, negative returns do not occur in back to back years often, while positive returns do often occur in consecutive years. There were only 5 consecutive-year periods where performance was negative (four periods lasted two years and one period lasted four years). There were 19 periods in which micro-cap equities rose for two or more years in a row. Of the 19 consecutive-year periods of positive returns, 6 lasted two years, 4 lasted three years and 6 lasted four years or more.
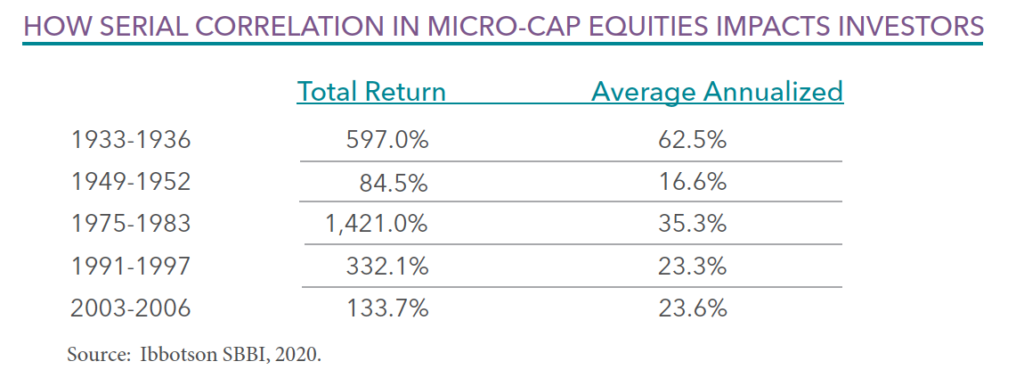
The annualized and total return performance of the five periods which lasted four or more years are listed above. This type of serial correlation to the upside demonstrates why many patient investors have earned significant rewards, notably in the micro-cap equities.
*For example, micro-cap equities had a negative return in 1937, positive returns in 1938 and 1939, negative returns in 1940 and 1941 and then a string of positive returns from 1942 to 1945. This example includes four distinct performance periods: one single-year period of negative returns (1937), two consecutive-year periods of positive returns (1938-39, 1942-45) and one consecutive-year period of negative return (1940-41).
Manager Commentary, 3rd Quarter 2015
OUR BULLISH TAKE ON SMALL-CAPS
The third quarter of 2015 started off strong for stocks, with large-cap stocks climbing more than 3 percent and small-cap stocks climbing more than 1 percent in the first two weeks of July, but that rally quickly faded. As measured by the S&P 500 Index, large-cap stocks lost 6.44 percent in the third quarter and small-cap stocks fared much worse. As measured by the Russell 2000 Index, small-cap stocks lost 11.92 percent and the Russell Microcap Index declined by 13.78 percent. While each of the Perritt Fund’s products performed better than their respective benchmarks, the investment losses are disappointing. However, there are several reasons to be positive, particularly for small-cap stocks.
According to Furey Research Partners, “whenever small-cap stock returns have been this poor in the third quarter, fourth quarter returns and even forward 6-month returns have been positive. Since 1940, excluding third quarter 2015, there have been 11 other years in which small-cap stocks were down 10 percent or more in the third quarter.* On 10 of those 11 occasions, small-cap stocks posted positive returns in the fourth quarter. Another bullish supporting point, the average bull market lasts seven plus years while the current bull market is only 6 years old.” While the past behavior of the market can’t predict the future, we believe the recent declines present an attractive entry point for new investments.
BEARS ARGUE ELEVATED MARGINS CREATE VALUATION DISTORTION
But…small-cap margins are far from peak levels while elevated large-cap margins can make M&A easier.
 (Click for larger image)
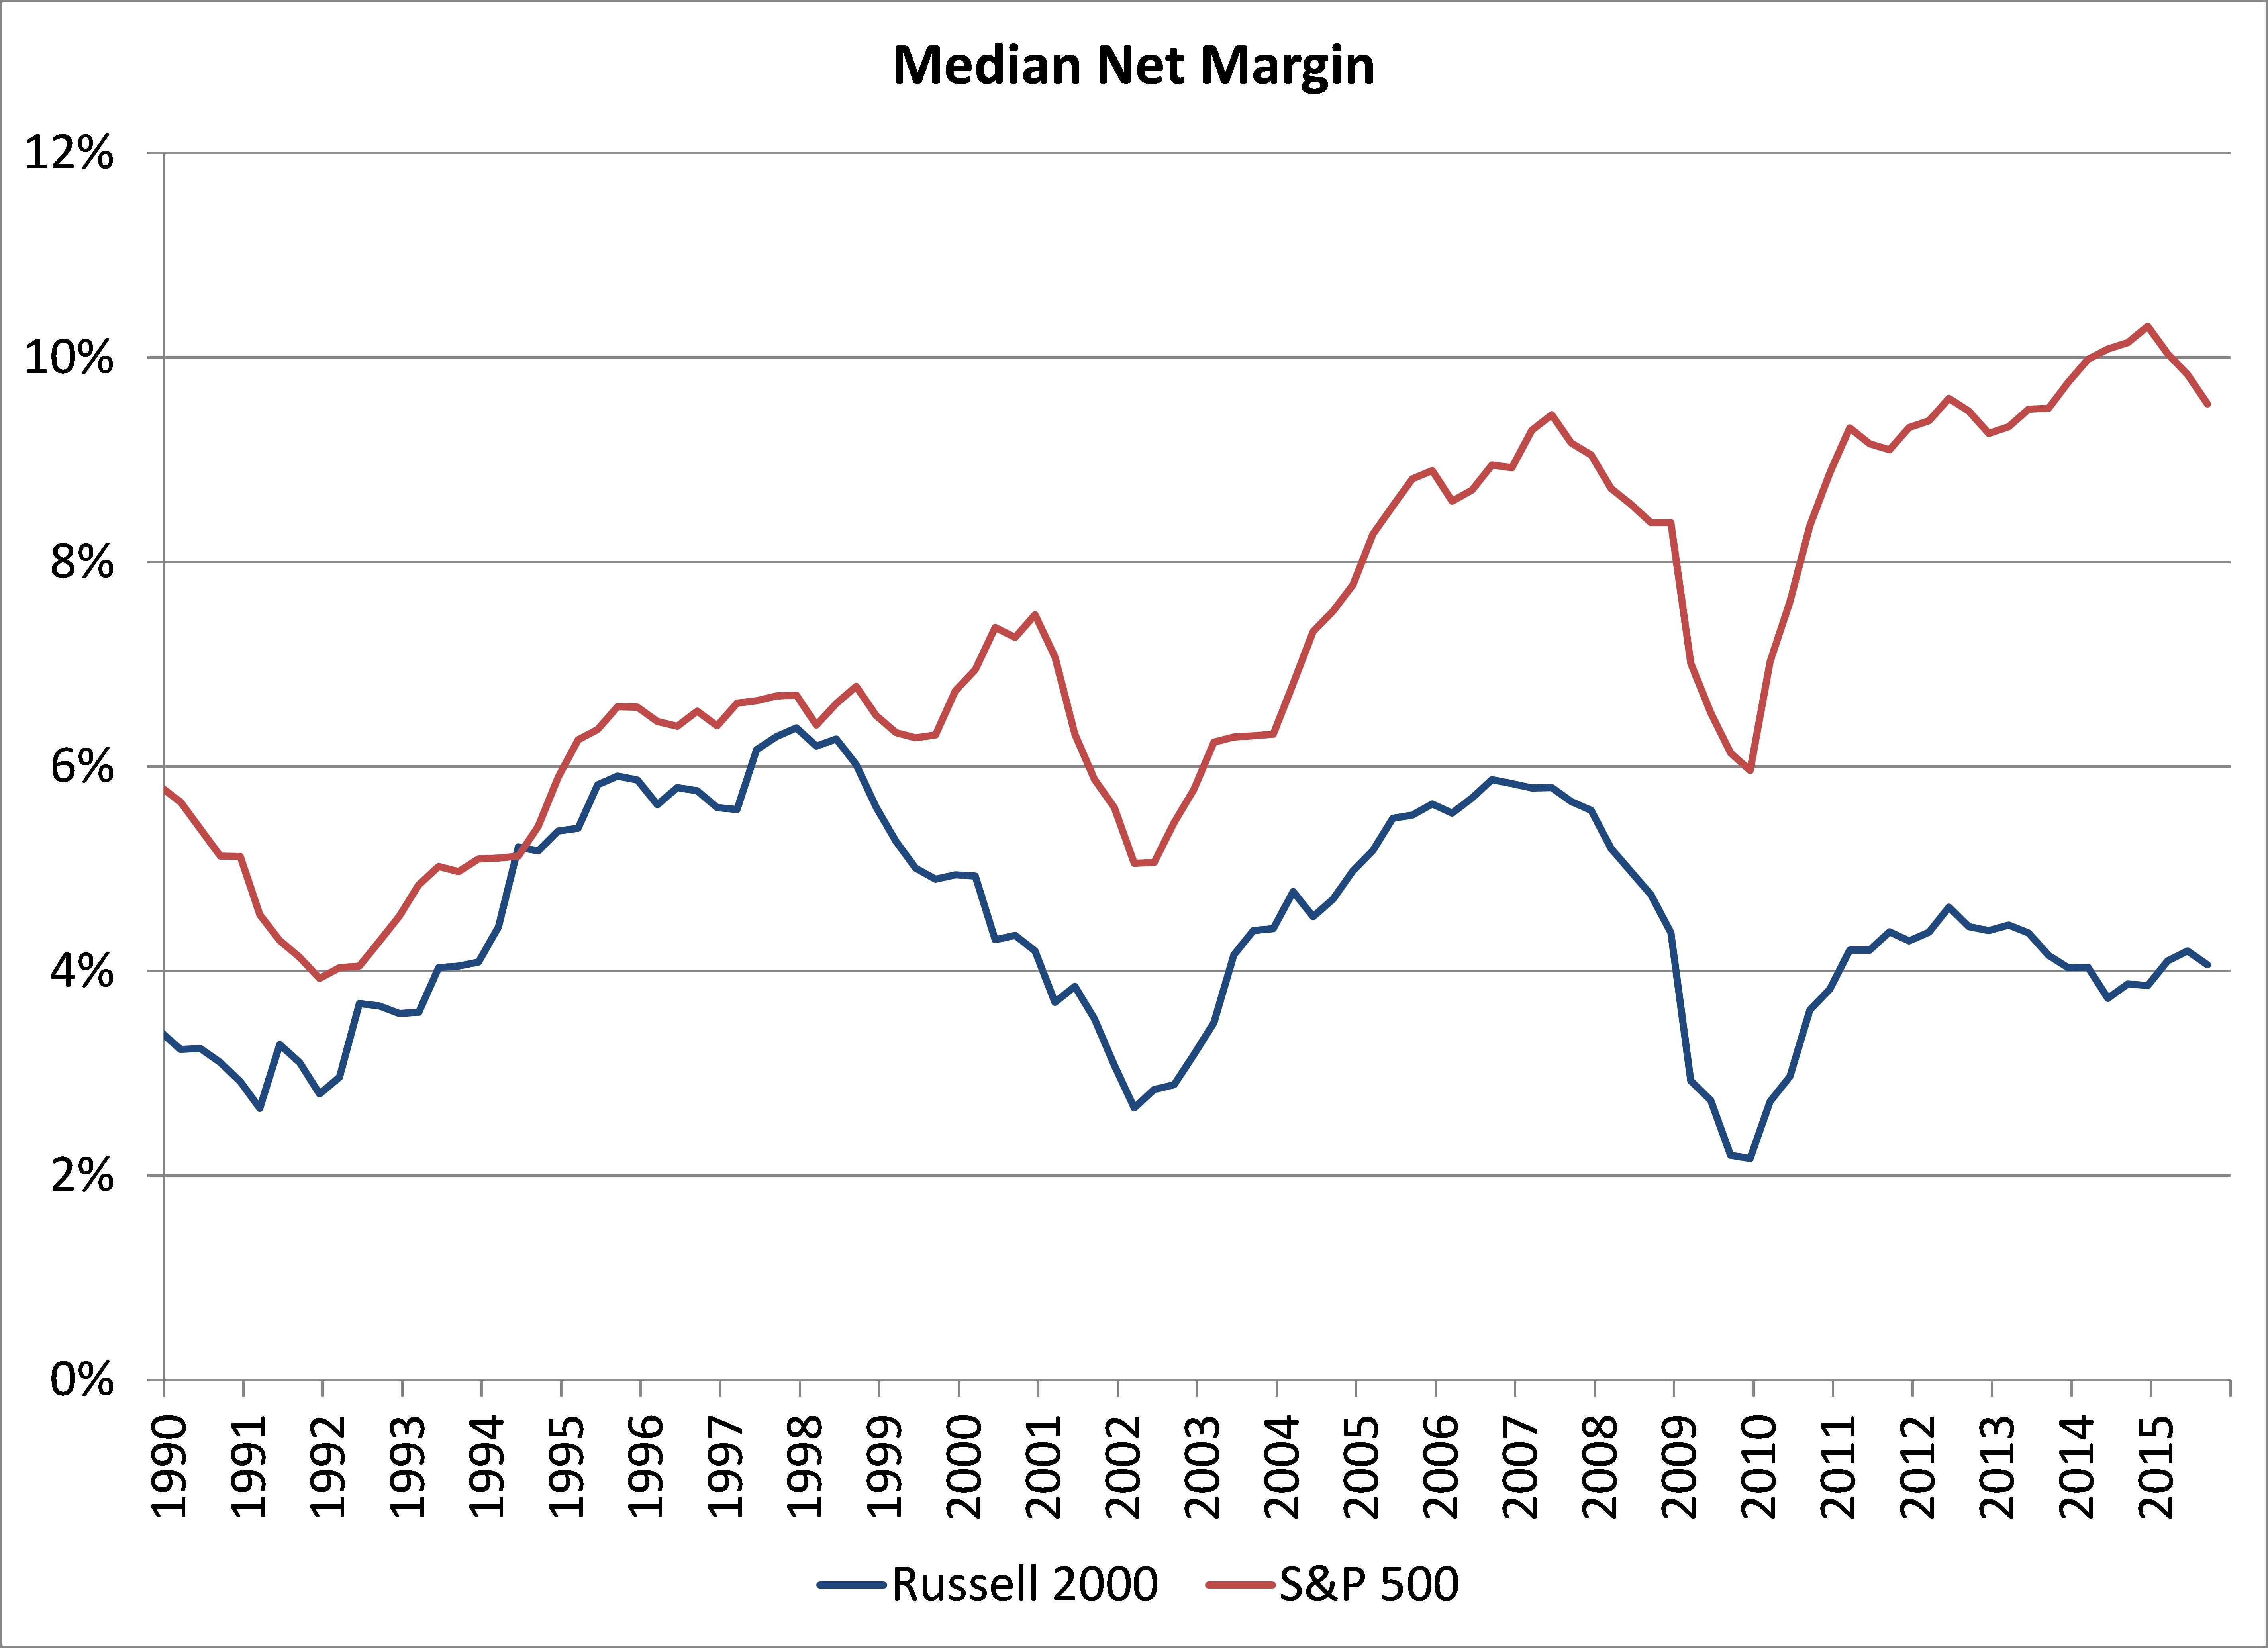
Bears have often argued that net margins are too high and normal competitive pressures should bring net margins lower. As can be seen in the graph, large-cap stock’s net margins have climbed significantly in the past few years, and even since the early 1990’s. While net margins have modestly improved in the past few years for small-cap stocks, they have been stagnant for the past two decades. We believe net margins have not improved for smaller-cap stocks due to their business investments. In fact, capital expenditures have been rising significantly for the average company within our MicroCap Opportunities Fund. We will outline this interesting fact in a new white paper next month. Please stayed tuned.
The research team at Perritt Capital Management just finished putting together our Perritt Small-Cap Insights, a comprehensive report with more than 50 slides of charts and tables detailing our positive outlook for small-cap stocks. Here we present a few charts from that comprehensive report. E-mail Mark Oberrotman – mark@perrittcap.com, or call 800-331- 8936 if you would like to see the full deck of slides.
As we mentioned in one of our commentaries last year, we believe small-cap stock indexes did not reach the full definition of a bear market, but micro-cap stocks did experience a stealth bear market. A stealth bear market is one where many stocks decline by more than 20 percent, but the index has not declined by more than 20 percent. Once again, the Russell 2000 Index and the Russell Microcap Index have not reached the bear market definition this year, but the average stock is in a bear market. There are 1,681 stocks in the Russell Microcap Index, and 1,051 of the companies declined more than 20 percent from their highs. In fact, the average decline of these 1,051 companies is 32.5 percent. While this performance is certainly discouraging, historically some bear markets have not lasted more than two years.
SMALL-CAP RELATIVE MARGINS AT CYCLICAL LOW?
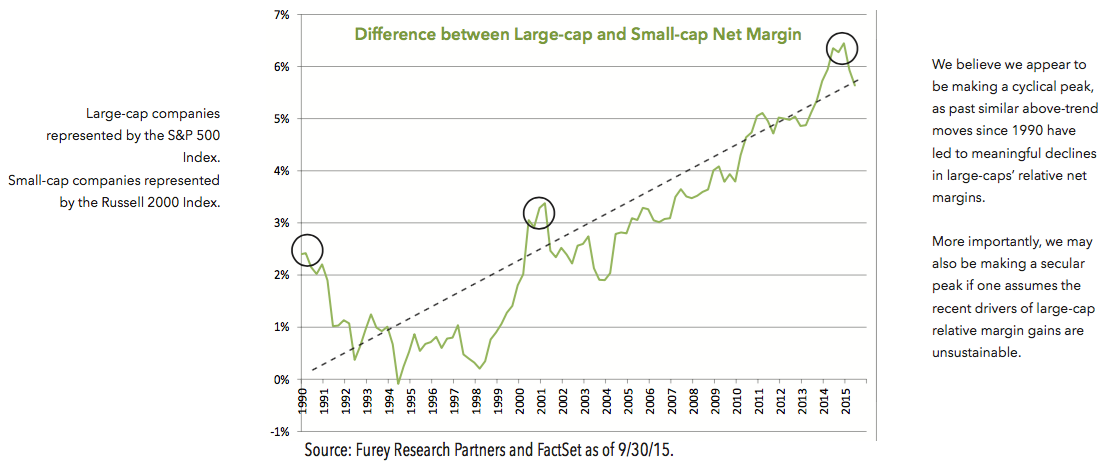
- Margins have accelerated faster in large-cap companies than small-cap companies, helping to boost large-cap earnings
- Large-cap margins recently hit a peak relative to small-cap margins
- At previous peaks, small-cap margins have improved relative to large-caps, helping to drive small-cap out-performance cycles
The next chart is more evidence that small-cap stock margins could improve in the near future. This chart shows the rela- tive net margins of large-cap stocks to small-cap stocks. We believe that large-cap stocks are making a cyclical peak, as past similar above-trend moves, since 1990 have led to meaningful declines in large-caps’ relative net margins. Our research and conversations with small-cap stock management teams also leads us to believe that net margins should improve for smaller stocks.
Large-cap margins have been rising relative to small-caps for nearly 25+ years, but can this continue?
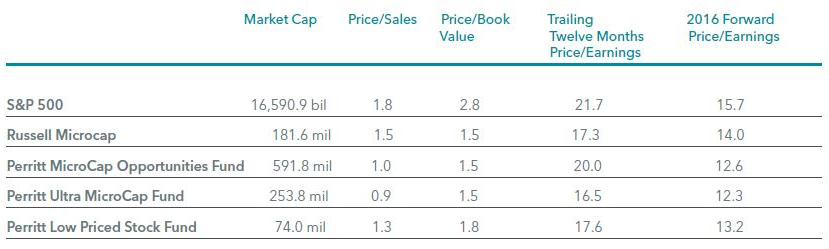
The final chart is one of our favorites. These two tables below not only show that small-cap stocks are less expensive than large- cap stocks, we believe they also should have the strongest earnings growth over the next few years. For example, the price-to sales ratio for the S&P 500 Index is 1.8 versus 1.5 for the Russell Microcap Index. In addition, each of our Funds are more attrac- tively priced based upon price/sales relative to that of Russell Microcap Index. The price-to-book value ratio and forward price earnings ratio of the Russell Microcap Index and our funds are more attractive than S&P 500 Index. Finally, the implied 2016 earnings per share growth for small-cap stocks are much stronger than large-stocks. For example, the Russell Microcap Index has an implied earnings growth of 20% vs. the S&P 500 earnings growth of 16%.
SMALL CAPS VS. LARGE CAPS: WHERE CAN INVESTORS FIND GROWTH?
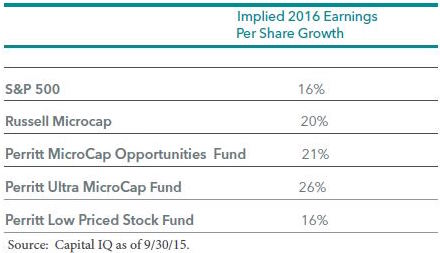
“Small-cap stocks are less expensive than large-cap stocks and we believe they also should have the strongest earnings growth over the next few years.”
Wall Street Journal – September 2015
The Perritt Low Priced Stock Fund was named a Category King by The Wall Street Journal for 9/30/2015 amongst Small Cap Core Funds based on Lipper data. The Category King award recognizes the top 10 funds of each category for one year total returns. You can see more by clicking here.
Please click here for standardized performance.
Performance data quoted represents past performance; past performance does not guarantee future results. The investment return and principal value of an investment will fluctuate so that an investor’s shares, when redeemed, may be worth more or less than their original cost. Current performance of the fund may be lower or higher than the performance quoted. Performance data current to the most recent month end may be obtained by calling 800-331-8936.
The Fund was ranked 969 out of 986 Small Cap Core Funds by Lipper for the one-year period and 436 out of 687 for the five-year period ending 9/30/2018. The Wall Street Journal (WSJ) ranking is based on Lipper data. However, the WSJ only considers the largest class of a Fund in their “pool” of Funds for any particular category, whereas Lipper counts every class of a Fund as a separate ranking entity. Because the number of Funds in the WSJ ranking category may be smaller than the Lipper category, the WSJ ranking for the Fund may be higher than the Lipper ranking. References to other mutual funds should not be viewed as an offer of these securities.
Lipper Analytical Services, Inc. is an independent mutual fund research and rating service. Each Lipper average represents a universe of Funds with similar investment objectives. Rankings for the periods shown are based on Fund total returns with dividends and distributions reinvested and do not reflect sales charges.
The Perritt Low Priced Stock Fund did not win the Category King award as of 9/30/17.
Bloomberg Business – September 2015
While global stocks were plummeting in August on the heels of China’s market crash, MagicJack VocalTec Ltd. was having its biggest rally in more than a year.
Portfolio manager, Michael Corbett provides comments on the company.
To read the full article, see the September 5, 2015 issue of Bloomberg Business.
Perritt Capital Management is the adviser to The Perritt Funds. The Perritt Ultra MicroCap Fund held a 1.5% holding in MagicJack as of 8/31/15. The Perritt MicroCap Opportunities Fund and the Perritt Low Priced Stock Fund did not hold a position in Magic Jack as of 8/31/15. Fund holdings and/or sector allocations are subject to change at any time are not recommendations to buy or sell any security.
Past performance is not a guarantee of future results. Index performance is not indicative of Fund performance. Current standardized performance of the Fund may be obtained by clicking here. It is not possible to invest directly in an index.
U.S. News & World Report – September 2015
With relatively few companies going public this year, and an energetic mergers and acquisitions market, micro-cap funds are one way to cash in on the innovation, imagination and energy of successful small companies.
Click here to read the full article
IPO – Initial Pubic Offering is the first sale of stock by a private company. IPOs are often issued by smaller, younger companies seeking the capital to expand, but can also be done by large privately owned companies looking to become publicly traded.
Diversification does not assure a profit nor protect against loss in a declining market.
Perritt Capital Management is the adviser to The Perritt Funds.
Past performance is not a guarantee of future results. Index performance is not indicative of Fund performance. Current standardized performance of the Fund may be obtained by clicking here. It is not possible to invest directly in an index.
As of August 31, 2015, The Perritt Funds did not hold a position in Noodles & Co. (NDLS) or Potbelly Corp. (PBPB). Fund holdings and/or sector allocations are subject to change at any time and are not recommendations to buy or sell any security.
Manager Commentary, 2nd Quarter 2015
“I Wish I Knew Then What I Know Now.”
You can learn a lot about investing in three years, even when you’ve been at it for more than two decades. This past June our original shareholders in The Perritt Low Priced Stock Fund (PLOWX) celebrated a three-year track record. As the lyric above conveys, if we were to do it all again, we would change a few things (launch the Fund in 2009, for example). But there is a certain excitement that youth brings, and the Fund’s first three years were no exception.
Along with its three-year anniversary, The Perritt Low Priced Stock Fund (PLOWX) was named Category King in The Wall Street Journal as of 6/30/2015 amongst Small Cap Core Funds, based on Lipper data. The Category King award recognizes the top 10 funds of each category for one year total returns.
MORE CONCENTRATED POSITIONS
In our twenty-plus year history investing in micro-cap companies, we’ve always understood that it is necessary to invest across a diverse portfolio of one-hundred or more micro-cap names. Companies of this small size are often dependent on a single product line or single customer so one negative news event can cause a swift market reaction. Broad diversification can potentially safeguard portfolio assets from downturns and keep us ready to jump on new opportunities. As you go up the market-cap scale into low priced/small-cap companies, this risk is reduced, allowing us to allocate more to our proven ideas.
80/20 RULE
The 80/20 rule – 80 percent of your return comes from 20 percent of your ideas – is a phenomenon that we have experienced across all of our strategies. The fact that a low-priced stock strategy allows for a more concentrated positioning has enhanced results. Below are the ten best performing investments in the fund since inception, which have certainly helped drive portfolio returns.
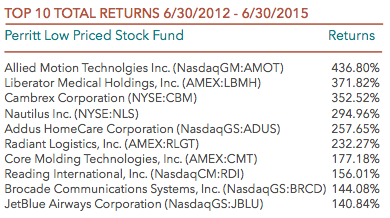
“Along with its three- year anniversary, The Perritt Low Priced Stock Fund (PLOWX) was named Category King in The Wall Street Journal.”
STOCK SELECTION
Our firm’s investment process is based on an ability to find under-followed companies that provide compelling stories, growing businesses, and attractive valuations. A case study in stock selection is 1-800-Flowers (FLWRS), a top contributor to fund performance in 2015. 1-800-Flowers is well-known to most consumers (show someone you’re thinking of them now, you can thank us later). The stock was something of a fallen angel from its tech-fueled heights in the late 90s. In fact, business has increased four times from what it was in 1999, yet the stock still sits below its peak. What attracted us to FLWS was its management’s clear vision to leverage strong brands to make 1-800-Flowers.com a prime destination for online gift-giving of all sorts. Management began purchasing brands, such as Fannie May Chocolates and the Popcorn Factory to add to its stable of baskets, fruits, and other products. A true catalyst for FLWS was the purchase of Harry and David gourmet gifts brand, which we felt was at a bargain price of less than 6x EBITA and immediately accretive. The market agreed, and the stock grew from $5.00 to $12.00 in less than a year.
NIMBLE LIQUIDITY
We believe the “illiquidity premium” is a compelling reason why investors should add micro-cap equities to their portfolio. We will strive to reward our investors willing to accept the illiquidity inherent in micro-caps. Frankly, we’ve built our firm on this idea.
However, as you climb the market-cap scale from micro- to small-cap, we believe there is a certain value to be found in trading illiquidity for agility. Seeking larger market-cap names opens trading doors to more opportu- nistic and strategic moves. In the FLWS example above, we were able to trade around this position following the merger anouncement, as the stock soared from $5.00 to above $12.00, where we sold part of our position, before falling back to below $10.00 where we bought shares again. Shorter term tactics are not a significant part of our investment process, but in this example they did allow for one of the highest-contributing names during the year.
We are proud that we can now offer our shareholders a fund option with a track record of 20-plus years (PRCGX), 10-plus years (PREOX), and now 3-plus years (PLOWX). We look forward to many more decades of investing, and we ask that you join us!
VALUATIONS: THE “OVER-RICH” GET RICHER
The Perritt Low Priced Stock Fund’s success in 2015 has been something of an anomaly in an environment that has favored passive indexes. The Perritt MicroCap Opportunities Fund has certainly suffered from this trend, as returns have lagged the Russell Microcap Index. The Perritt Ultra MicroCap Fund – recently named to the Charles Schwab Mutual Fund OneSource Select ListTM– in our opinion has no true benchmark that can provide accurate comparison based on its characteristics. It continues to march to its own drum, as seen by its market capitalization of $77M and r-squared of 0.30 as of 6/30/15. This indicates how the companies in the portfolio are extremely small and have low correlation to the market.
“Our firm’s investment process is based on an ability to find under-followed companies that provide compelling stories, growing businesses, and attractive valuations.”
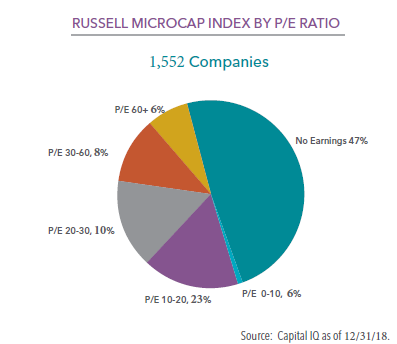
A single chart below shows why 2015 has been a difficult year for active small/micro-cap managers. Simply put, companies in the Russell 2000 Index with negative EBIT have provided twice as much return as those with positive earnings. Companies with no earnings have provided 13.0% return in 2015 as compared to just 6.3% for compa- nies that are actually making money. Readers of our recent commentaries won’t be surprised to hear that the bulk of the Index returns are being provided by Biotech companies which would be unlikely to pass close analysis of an active manager.
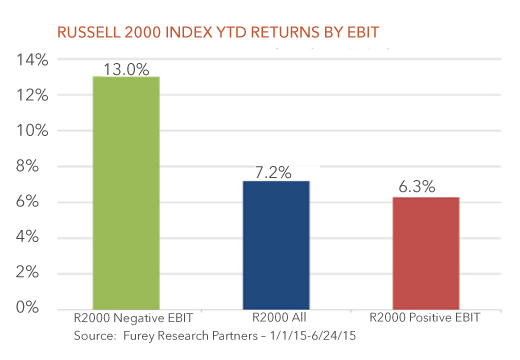
“Companies in the Russell 2000 Index with negative EBIT have provided twice as much return as those with positive earnings.”
The trend of negative EBIT companies driving performance is similar when you look at the Russell Microcap Index, which is even more concentrated among a few high-flying names. Biotech stocks in the Russell Microcap Index contributed to 3.9% of the Index’s 6.0% performance YTD (equivalent to 65% of the YTD return), influenced by a very narrow group of holdings (the top 10 contributing Biotech stocks made up a full 2.6% of the Index return). Given the lofty valuations of the sector, we believe the Biotech companies that may succeed are priced for perfection, the rest are priced for disaster. We saw a glimpse of this devastation with the recent blowups of Sunesis Pharmaceuticals, Inc. (SNSS) loss of 77% in one day and XOMA Corp. (XOMA) loss of 71% also in one day following disappointing trial results/FDA rulings.
We may not know when this trend will turn, but in our two-decades of small-cap investing, we have seen similar periods. When the most profitable and well-run companies are the least favored by the market, opportunities may become plentiful for active managers who have diligence and patience. Negative EBIT companies cannot be the small/micro-cap leadership group forever.
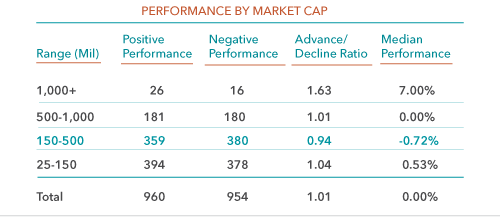
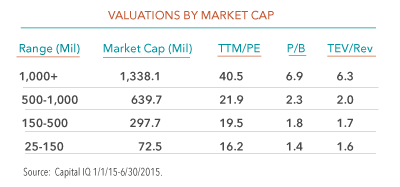
The charts below show performance and valuations according to company size. As seen, the larger the company, the stronger the performance so far in 2015. We believe valuations point to the most compelling opportunities in the smaller-market cap segment of the universe.
Charles Schwab – July 2015
The Perritt Ultra MicroCap Fund (PREOX) was named to Charles Schwab’s Mutual Fund OneSource Select List as of 6/30/2015. The Mutual Fund OneSource Select List is a list of no-load and no-transaction fee mutual funds that the Charles Schwab Investment Advisory, Inc. has screened rigorously for performance, risk, and expenses. The OneSource Select List™’s purpose is to help investors sort through the thousands of available mutual funds with a carefully screened list of top-tier offerings.
To view the Press Release, click here.
Michael Corbett Interview
In this interview, Portfolio Manager Michael Corbett discusses the launch of the new Low Price Stock Fund (PLOWX), the uniqueness of the firm’s process, keys to Perritt Capital Management’s success and the firm’s goals for 2014.
Click below to listen to the interview with Michael Corbett.
Sidoiti & Co. Micro-Cap Conference

Perritt analyst George Metrou, CFA meets with boutique micro-cap research firm owner Peter Sidoti prior to the Sidoti & Co. Micro-cap Conference.
The Semi−Annual Microcap Conference is held in New York, NY by Sidoti & Co., part of our established network of research partners. Sidoti & Company, LLC, founded in 1999, provides unbiased, institutional-quality research focusing on the investment merits of profitable companies at a sub-$3 billion market cap. The firm also specializes in micro-cap research, launching coverage of more than 400 equities with market capitalizations of $250 million or less since mid-2010.
CNBC – December, 2013
In this FUND VIEW Feature, Portfolio Manager Michael Corbett discusses the Ultra Micro-cap strategy, which invests in only “the smallest of the small” companies that he believes will give him the biggest gains. The Ultra MicroCap Fund focuses on niche-businesses like USA Technologies Inc, a company with a market value of $60 million which provides software that allows someone to use a credit card at a vending machine or laundromat.
To View “Fund View,” visit CNBC.
MicroCapClub – December, 2013
In the second round of interviews with the MicroCapClub, Portfolio Manager Michael Corbett discusses the firm’s history, investment process and where we are finding investment opportunities in the micro-cap space.
To listen to the interview visit the MicroCapClub.
The MicroCapClub is an exclusive forum for experienced micro-cap investors focused on microcap companies (sub $300m market cap). MicroCapClub was created to be a platform for experienced microcap investors to share and discuss stock ideas.
MicroCapClub – December, 2013
Thirty years ago a microcap was defined as a public company with market cap under $50 million. Today, many investors define micro-cap as less than $300 million, while some leading firms increase that threshold to $750 million. Is Micro-cap Getting Too Big takes an in-depth look at this transformation and what it means for microcap investors. Micro-cap funds (and their definition of micro-cap) are getting bigger, but not surprisingly the most pricing-inefficiencies are shown to be found in the smallest companies. The Ultra MicroCap Fund is highlighted as remaining true to the space, confirmed by it having the smallest market capitalization of all domestic equity funds according to Morningstar as of 12/31/13
To View “Is Micro-cap Getting to Big?” Visit the MicroCapClub.
The MicroCapClub is an exclusive forum for experienced microcap investors focused on microcap companies (sub $300m market cap). MicroCapClub was created to be a platform for experienced micro-cap investors to share and discuss stock ideas.
Manager Commentary, 4th Quarter 2013
Why Invest In Micro-Cap?
Numbers Speak Louder Than Words: 2013 Review
“Why should I include micro-cap as part of my small-cap allocation?” It is a question we hear often from investors. The answer is that, since 1926, micro-cap investments have increased the return and reduced correlation within a diversified portfolio (as documented by Rolf Banz & Ibbotson & Associates1). Ask an investor to consider the benefits shown in 87 years of data, however, and you’ll quickly see their eyes begin to glaze over. The rewards of investing in micro-cap are easier to understand when you look closely at a period when micro-caps began to perform well. Last year was certainly part of this cycle, as we will see below:
The chart below illustrates why we believe it makes sense to include micro-cap within a small-cap allocation.
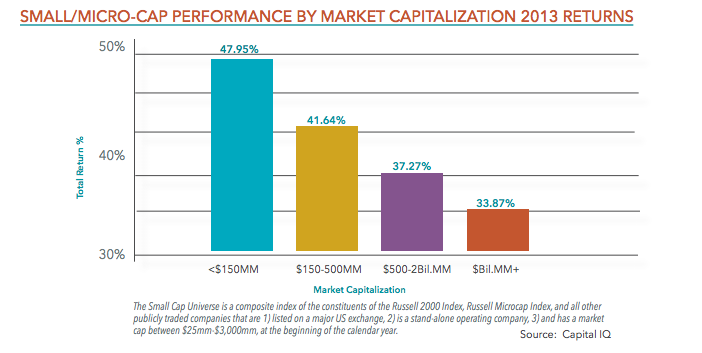
We believe that the inefficiencies that exist in the micro-cap asset class make it a good place for active management. After a few years where active management lagged, the trend shifted in 2013. With certain companies becoming too expensive in our opinion (and the Russell Microcap Index’s nearly 30% weight to Financials), we believe this trend can continue.
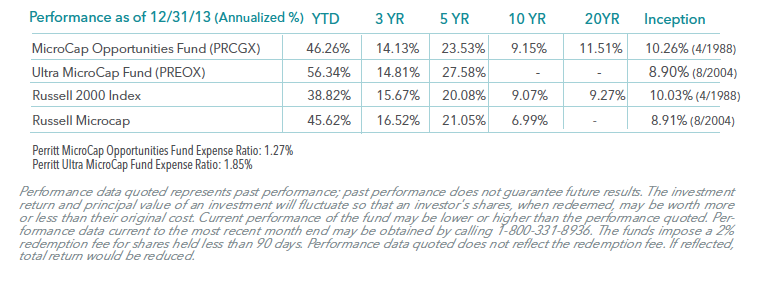
Please click fund for annualized performance; PRCGX, PREOX and PLOWX.
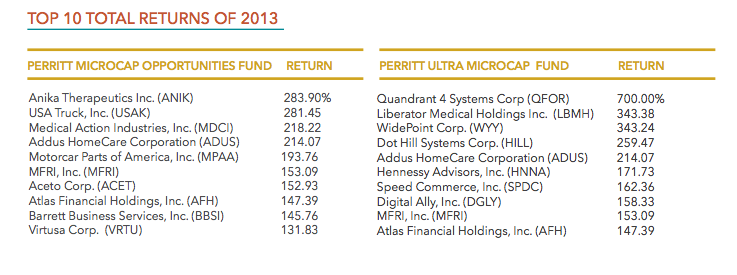
80/20 Rule: Big Winners Drive Returns
Current standardized performance of the Fund and performance data to the most recent month end may be obtained by clicking here. It is not possible to invest directly in an index.
As is usually the case in micro-cap investing, the investments that worked best accounted for much of the overall return. By the end of the year, we had taken profits on all of the below names to reinvest in what we believe could be next year’s winners.
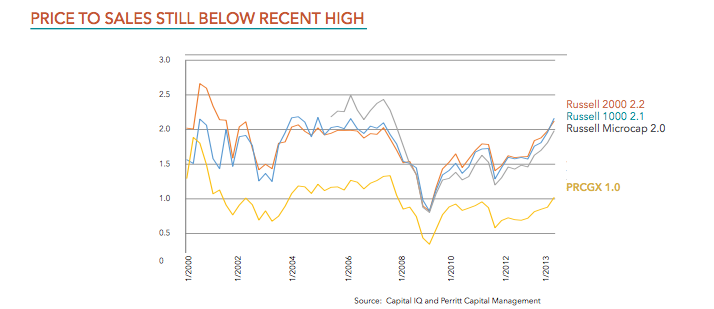
Valuations Still Below Recent Highs
Price-to-Sales Ratios for are still below recent highs. For a more detailed analysis of recent valuations see our recent research paper: Are Micro-cap stock valuations high or low? Maybe both.
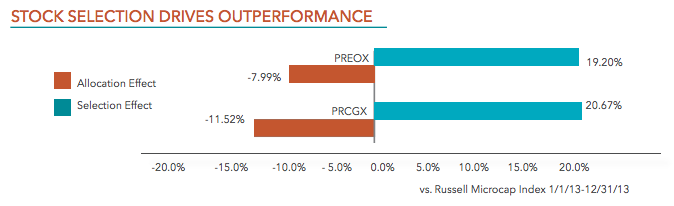
Attribution Analysis
MicroCap Opportunities Fund (PRCGX)
- The MicroCap Opportunities Fund gained 46.26 for the year, outperforming both the Russell 2000 and the Russell Microcap Indexes.
- Stock selection was the key driver of outperformance. As seen in the table above, stock selection accounted for nearly 20% of relative performance. This is largely attributed to the 80/20 rule as discussed in this commentary.
- Stock selection was most pronounced in the Financials and Health Care sectors. Bank of the Internet (BOFI) and Virtus (VRTS) were financials positions which were sold due to valuations after gaining 129% and 93% for the portfolio, respectively. Two of the Fund’s top five performing investments were Health Care related: Addus (ADUS, 214% return) and Anika (ANIK, 284%).
- Stock selection accounted for positive relative returns in 8 out of 9 sectors, indicating that our bottomup investment process was certainly a success in 2013.
- While our allocation effect was negative in all but 3 sectors (Financials, Industrials, and Utilities) we believe this emphasizes the fact that we are not closet indexers and look to invest in opportunities with out regard to the Index’s weighting.
Attribution Analysis
Ultra MicroCap Fund (PREOX)
- The Ultra MicroCap Fund gained 56.34% in the year, versus 45.62% for the Russell MicroCap Index.
- We always stress the difficulty of comparing this fund to a benchmark as it invests in companies far below the traditional radar, as demonstrated by its median market capitalization of just $79 Million (as of 12/31/13).
- Stock selection accounted for nearly 20% of relative outperformance. Financials and Technology were the best performing sectors.
- The top five contributors added 12.3% to the fund’s return while the bottom five detracted only 3.7%. This illustrates how our diversified approach of holding 100+ names and starting positions at just 0.5% -1.0% of the portfolio can provide downside protection.
- True to our philosophy when launching this strategy, the fund has tended to behave differently than the markets this year, as seen in the beta vs. the Russell Microcap of 0.71 & r-squared of 0.74.
Are Micro-cap stock valuations high or low? Maybe both.
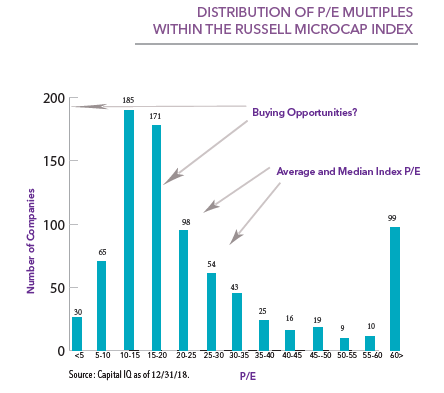
The Skewed Distribution of Micro-cap Index Valuations
Is an asset class expensive or cheap? Asked this question, most advisors look first to the relative index. Is an asset class expensive or cheap? Asked this question, most advisors look first to the relative index. An index represents a broad group of stocks and provides a general feel for where valuations lie at the given moment. But what does the P/E Ratio of an index tell us about the underlying buying opportunities? We analyzed the valuations of all of the companies in the Russell Microcap Index to help inform our readers. As it turns out, like most things microcap, this one number tells us very little.
All of the individual companies that make up the Russell Microcap Index are sorted by P/E ratio in the table to the right. As can be seen, the distribution is distinctly right tailed, and “bi-modal.” This bi-modal nature of the distribution significantly distorts the calculation of averages and medians, masking the true set of potential buying opportunities.
As seen, the headline P/E of the Russell Microcap Index actually tells us very little about individual buying opportunities. Despite the index’s relatively steep valuation, there are more than 280 individual companies with a P/E below 15, twice as many companies as typically make up an active micro-cap manager’s entire portfolio. This does not even factor in the 709 companies in the index that have negative earnings – some of which could be on the verge of profitability. It is up to the skills and experience of active managers to avoid “value traps” or other issues often found in these lower P/E buckets. The point is that investors who look under the hood can see a wide range of opportunities with valuations that differ greatly from the “headline” P/E of the index.
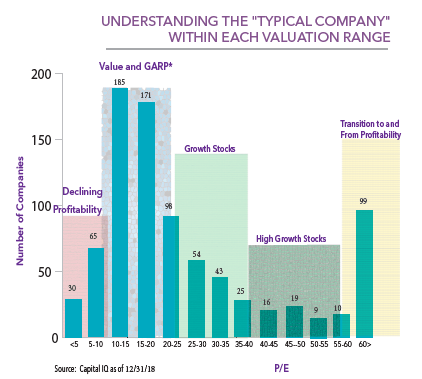
Look Under the Hood: Understanding the “Typical Company” in each Valuation Range
Micro-cap investors can find opportunities in any of the valuation groupings we’ve outlined in the chart to the right. Having an investment process that demands specific analysis depending on the valuation range can provide an advantage to the index. Value traps need to be detected from deep-value plays, as expected. Many growth or high growth stocks might be deemed expensive based on declining or stable growth rates; others could be in an early phase of expansion where a 30 P/E is in fact inexpensive compared to the future upside. On the far right of the chart, companies trading at 60x multiples don’t tell us much about valuations in the micro-cap space, let alone the fundamentals. These are generally companies that have just become profitable, or are on the verge of becoming unprofitable. Unfortunately, each one is factored into the calculation of the index’s valuation.
Micro-Cap Asset Class is Vast
The micro-cap asset class is vast. Our investable universe includes approximately 3,000 companies with valuations and characteristics that vary widely. The microcap index “skew” of valuations comes into play during all periods we researched since 2005 (when data for the Microcap Index became available and a full market cycle in our view). Compare this to large-cap investing. Today, the P/E of the S&P 500 is 25. With so many eyes on each of the 500 companies there is little room for inefficiencies. And with only 500 names to choose from, the index’s P/E of 25 is more truly reflective of that investable universe. As expected, it is a much more normal distribution.
Active micro-cap managers have a significant opportunity to focus on investments that can potentially provide much greater upside than the index as a whole. Over full market cycles, it is this skill of separating the potential gems from the crowd that makes quality managers endure.

In summary, Micro-cap is a space that can’t be neatly summarized in one valuation number or forecast. So can we answer the question, is the micro-cap expensive or cheap? Well, maybe both:
The SUIT – November, 2013
THE SUIT magazine provides in-depth analyses of successful corporate executives, business owners and professionals, along with topical investigative news reporting, combining a trade approach with a journalistic emphasis. Here The SUIT profiles of Portfolio Manager Michael Corbett from his rise from investment analyst of Perritt Capital Management to Portfolio Manager and majority owner.
To download “Ignoring MicroCaps? Think Again” click here.
Manager Commentary, 3rd Quarter 2013
Should I Stay or Should I Go?
Evaluating MicroCap Valuations in a Rising Market
Both of our microcap funds reached all-times highs during the quarter. As
we explained in our research paper Deja vu All Over Again: Serial Correlation
and Micro-Cap Equities, investors shouldn’t be surprised that micro-cap
stocks have continued to provide rewards after a strong year in 2012. Periods
of strong micro-cap performance, such as what began last year, typically last
several years or more.
Following our recent strong performance, however, many investors are asking
us if valuations have become stretched. We can answer this by showing how
we examine valuations as part of our investment process. Simply put, the question we ask ourselves when deciding if we should let a winner run is: “can this become a multi-billion dollar company?”
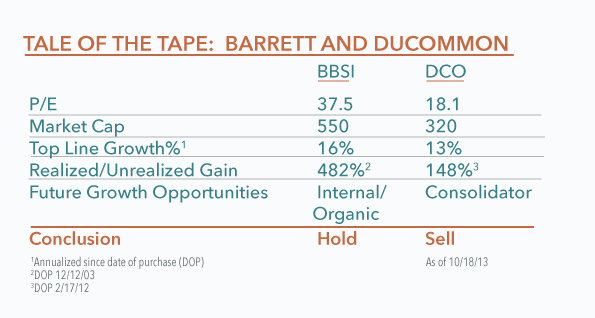
When is a 20 P/E Too High?
When a previously underfollowed company begins to attract the market’s attention the gains can be significant, prompting us to decide if it is time to “feed the chickens,” or sell the stock to the next tier of small- or mid-cap investors. However, some companies can justify P/E ratios of 20 or 30 if future growth opportunities remain compelling. Others, as we show below, cannot.
Barrett Business Services (BBSI) is an example of a company that we believe still has significant upside despite a higher P/E. Barrett helps HR departments of small-and mid-size companies outsource management and reduce cost inefficiencies. We first purchased the stock nearly ten years ago at $5 and a market cap of $55MM. Today Barrett is over $70 and the market cap is $550, but the company’s upside is still exciting. Barrett is growing its top line near 20%
and has done so consistently over the past decade. Despite this growth, the stock was stuck between $15 and $20 for many years until an overhang of shares was removed by management earlier this year, serving as a major catalyst for price appreciation.
Today, Barrett operates only on the West Coast, and the company is beginning to expand East. We believe the recent surge in price is only a reflection of the company’s true value that was previously mispriced. If Barrett can execute its expansion East, it can become a multi-billion dollar company, and investors would be rewarded from here.
Ducommun (DCO) is an example of a company that we decided to sell because of valuations, despite it being a recent winner in the portfolio. Ducommun provides components to the aerospace and defense industry including companies like Boeing. The company’s growth has been very impressive, expanding its market cap from $150 when we purchased it to over $300MM today. Much of this growth was bought through acquisition, however, as opposed to internal growth. We benefited from this consolidation play but future opportunities depend on the company continuing to acquire other businesses. In our view, the risks that Ducommun overpays for future acquisitions or is not able to integrate it properly outweigh the potential rewards. We decided to take profits on Ducommun despite its P/E of 18 being much lower than Barrett’s P/E of 33.
How Expensive is Your Asset Class? Look Beyond The Index
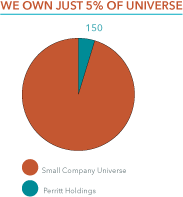
The micro-cap asset class is vast. Our investable universe includes approximately 3,000 companies with valuations and characteristics that vary widely. Generally, we own 100-150 names, about 5% of the universe. With so many options to choose from, the characteristics of our portfolio are not dependent on the average valuations of the index. There are hundreds of small companies with P/E ratios below 10. Conversely, many more can be found with P/E’s above 40. The fact that the P/E of the Russell Microcap Index is 19 actually tells us very little about individual buying opportunities.
Compare this to large-cap investing. Today the P/E of the S&P 500 is 20. With so many eyes on each of the 500 companies there is little room for inefficiencies. And with only 500 names to choose from, the index’s P/E of 20 is more truly reflective of the investable universe.
Next month we will be finishing a new research paper, The Skewed Distribution of Micro-cap Index Valuations, that looks to show how an accurate assessment of valuation for the micro-cap asset class requires a deeper analysis of the index. We take a look under the hood of the microcap index to show the distribution of companies by P/E ratios across the index. Readers will find that, like most things microcap, there is much more to the index than can be neatly summarized in one number.
Click here for standardized fund performance.
Performance data quoted represents past performance; past performance does not guarantee future results. The investment return and principal value of an investment will fluctuate so that an investor’s shares, when redeemed, may be worth more or less than their original cost. Current performance of the fund may be lower or higher than the performance quoted. Performance data current to the most recent month end may be obtained by calling 1-800-331-8936. The funds impose a 2% redemption fee for shares held less than 90 days. Performance data quoted does not reflect the redemption fee. If reflected, total return would be reduced.
MicroCap Opportunities Fund (PRCGX)
-
- The MicroCap Opportunities Fund gained 9.26% in the third quarter, and has now outperformed the Russell 2000 Index on a year to date basis while trailing the Russell MicroCap Index as of 9/30/13.
- Fund attribution often shows the 80/20 rule, where 20% of holdings provide 80% of returns. This year/quarter has been no different. Seven holdings are up 100% or more this year, and several of those drove performance in the quarter, including Addus (ADUS), Bank of the Internet (BOFI) and Century Casinos (CNTY).
- Stock selection was most pronounced in the Financials and Consumer Discretionary sectors. Stock selection in Financials added 1.80% versus the Russell 2000 Index and 1.71% versus the Russell MicroCap Index. Strong selection in the Financial sector more than made up for a relative under weight versus the index, which detracted from performance.
- Although portfolio returns in the technology sector were positive, stock selection detracted from relative performance. The portfolio return of technology names was 6.66% in the quarter vs. 14.21% for the Russell 2000 Index and 12.45% for the Russell Microcap Index.
Ultra MicroCap Fund (PREOX)
-
-
- The Ultra MicroCap Fund gained 12.81% in the third quarter, versus 11.62% for the Russell Micro Cap Index.
- We always stress the difficulty of comparing this fund to a benchmark as it invests in companies far below the traditional radar, as demonstrated by its average market capitalization of just $65 Million (the lowest of all 7.983 equity Funds, according to Morningstar as of 9/30/13).
- The fund has tended to behave differently than the markets this year and this quarter. Because they are not widely followed, many holdings have not reacted with the market on negative days, helping performance (as seen in the beta vs. the Russell microcap of 0.70 & r-squared of 0.77). It conversely has tended to lag on large positive days.
- Overall stock selection was strong, contributing 2.87% to relative performance. The largest gains were in Financials, which accounted for 2.50%. We are largely underweight Financials although the names we do hold performed well.
- Cash was a small drag on performance, detracting 0.74% vs. the benchmark. We have experienced positive flows, and there were also a few buy-outs near the end of the quarter that increased cash level.
-
Distribution
Due to recent gains, both Funds will pay a distribution in 2013. We expect to distribute only Long-Term Gains Record Date= 11/19/13 Ex-Date 11/20/13
MSN Money – September, 2013
Portfolio Manager Michael Corbett is interviewed by MSN Money in the article, “7 great stocks under $5.” As noted in the article, there is the potential for greater upside in a small company that is beginning to thrive as compared to a giant company where finding additional growth takes a lot of time.
To View “ 7 great stocks under $5.” Visit MSN Money.
The Motley Fool – September, 2013
The Perritt MicroCap Opportunities Fund was listed in Motely Fool’s “The Hidden Bargains in Micro Caps.” The portfolio’s investment in both Addus (ADUS) and Virtus ( VRTS), which increased more than 500% since the time of purchase, are highlighted.
To view “The Hidden Bargains in Micro Caps.” visit The Motely Fool.
Bloomberg News – September, 2013
Portfolio Manager Michael Corbett was interviewed by Bloomberg News for the article “Mark-Cuban Backed Rentrak Seen Luring Bids: Real M&A.” Corbett discusses excitement around Rentrak’s technology and how the firm has grown from its roots as a mom-and-pop video retailer: “This is a crossover story. It’s going from an old, legacy, boring declining business to a more exciting business. The new advertising tracking service is much more exciting to anybody out there.”
To view “Mark-Cuban Backed Rentrak Seen Luring Bids: Real M&A”, visit Bloomberg.com
Bloomberg News – July, 2013
Portfolio Manager Michael Corbett was interviewed by Bloomberg News for the article “Steinway Seen Striking Cord with Rival Bidders.” Asked if he believed there could be a rival bidder after the announced buy-out of the firm, Corbett said ““Given that Steinway is a pretty big name, there’s a possibility that others might be interested. We’re not willing to take that risk though, so we moved on.”
To view “Steinway Seen Striking Cord with Rival Bidders,” visit Bloomberg.com.
Red Chip Review – March, 2013
Michael Corbett, CIO and Portfolio Manager, discussed the firm’s investment strategy on “The RedChip Money Report in March 2013.”
“The RedChip Money Report”™ delivers insightful commentary on small-cap investing, interviews with Wall Street analysts, financial book reviews, as well as featured interviews with executives of public companies. The weekly program airs on Fox Business as well as My Family TV and TUFF TV.
InvestingDaily.com – February, 2013
The Perritt MicroCap Opportunities Fund is named in this article devoted to explaining the potential benefits inherent in a space known for scarce information and limited liquidity. A detailed description of the team’s investment process is provided.
To view “Micro-Caps: Tiny Companies, Potentially Powerful Gains,” visit Investingdaily.com.
Marin Independent Journal Trader’s Magazine – February, 2013
Portfolio Manager Michael Corbett is interviewed in this article as a shareholder of Hennessy Advisors following the announcement of an acquisition which nearly tripled the assets under Hennessy’s management. Asked about the acquisition, Corbett said, “”By combining forces, (FBR and Hennessy Advisors) can generate some synergy and bring down costs.”
To view the article, visit Marin Independent Journal Trader’s Magazine.
TheStreet.com – February 1, 2013
In this TheStreet.com video, “Big Bet on Century Casinos, Landec,”
Portfolio Manager Michael Corbett discusses several companies that are expanding their businesses and offer potentially significant upside to investors.
To view “Big Bet on Century Casinos, Landec,” visit TheStreet.com.
Trader’s Magazine – January, 2013
Director of Research/Equity Analyst George Metrou is interviewed in the article “Building Blocks for Building Block Trades.” In it he describes Perritt’s “old fashioned” trading process of using a network of 40-45 brokers across the country that have established a relationship of trust with the team.
To view “Building Blocks for Building Block Trades.” visit Trader’s Magazine (Free registration required.)
Barron’s – January, 2013
The Perritt MicroCap Opportunities Fund is named in the cover article of Barron’s “Is Your Fund Manager Active Enough?” listing managers evaluated by “active share.” Active share is a measure which tries to differentiate active managers from closet indexers.
To view “Is Your Fund Manager Active Enough?” visit Barron’s.
To see the accompanying table, “The Real Deals” click here.
Barron’s – January, 2013
The Perritt MicroCap Opportunities Fund is named in the cover article of Barron’s “Is Your Fund Manager Active Enough?” listing managers evaluated by “active share.” Active Share is a measure which tries to differentiate active managers from closet indexers.
To read “Is Your Fund Manager Active Enough?”, visit online.barrons.com.
Red Chip Review – March, 2013
Michael Corbett, CIO and Portfolio Manager, discusses the firm’s investment strategy on “The RedChip Money Report.”
“The RedChip Money Report”™ delivers insightful commentary on small-cap investing, interviews with Wall Street analysts, financial book reviews, as well as featured interviews with executives of public companies. The weekly program airs on Fox Business as well as My Family TV and TUFF TV.
To view, visit YouTube.
TheStreet.com – February 1, 2013
In this TheStreet.com video, “Big Bet on Century Casinos, Landec,” Portfolio Manager Michael Corbett discusses several companies that are expanding their businesses and offer potentially significant upside to investors.
To view, visit TheStreet.com.