Research & Whitepapers
Are Micro-cap stock valuations high or low? Maybe both.
The Skewed Distribution of Micro-cap Index Valuations
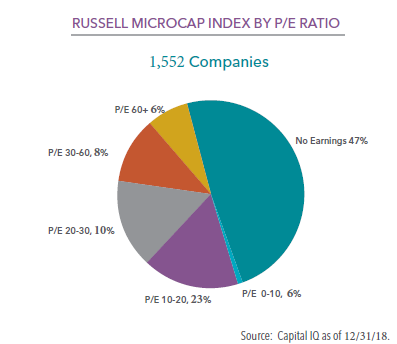
Is an asset class expensive or cheap? Asked this question, most advisors look first to the relative index. Is an asset class expensive or cheap? Asked this question, most advisors look first to the relative index. An index represents a broad group of stocks and provides a general feel for where valuations lie at the given moment. But what does the P/E Ratio of an index tell us about the underlying buying opportunities? We analyzed the valuations of all of the companies in the Russell Microcap Index to help inform our readers. As it turns out, like most things microcap, this one number tells us very little.
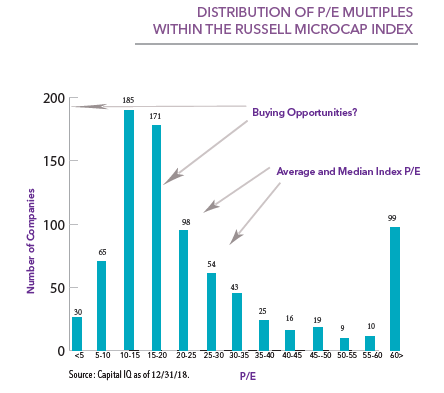
All of the individual companies that make up the Russell Microcap Index are sorted by P/E ratio in the table to the right. As can be seen, the distribution is distinctly right tailed, and “bi-modal.” This bi-modal nature of the distribution significantly distorts the calculation of averages and medians, masking the true set of potential buying opportunities.
As seen, the headline P/E of the Russell Microcap Index actually tells us very little about individual buying opportunities. Despite the index’s relatively steep valuation, there are more than 280 individual companies with a P/E below 15, twice as many companies as typically make up an active micro-cap manager’s entire portfolio. This does not even factor in the 709 companies in the index that have negative earnings – some of which could be on the verge of profitability. It is up to the skills and experience of active managers to avoid “value traps” or other issues often found in these lower P/E buckets. The point is that investors who look under the hood can see a wide range of opportunities with valuations that differ greatly from the “headline” P/E of the index.
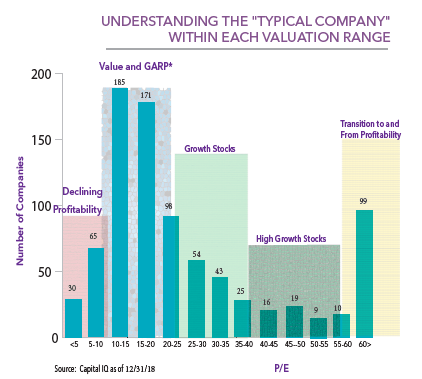
Look Under the Hood: Understanding the “Typical Company” in each Valuation Range
Micro-cap investors can find opportunities in any of the valuation groupings we’ve outlined in the chart to the right. Having an investment process that demands specific analysis depending on the valuation range can provide an advantage to the index. Value traps need to be detected from deep-value plays, as expected. Many growth or high growth stocks might be deemed expensive based on declining or stable growth rates; others could be in an early phase of expansion where a 30 P/E is in fact inexpensive compared to the future upside. On the far right of the chart, companies trading at 60x multiples don’t tell us much about valuations in the micro-cap space, let alone the fundamentals. These are generally companies that have just become profitable, or are on the verge of becoming unprofitable. Unfortunately, each one is factored into the calculation of the index’s valuation.
Micro-Cap Asset Class is Vast
The micro-cap asset class is vast. Our investable universe includes approximately 3,000 companies with valuations and characteristics that vary widely. The microcap index “skew” of valuations comes into play during all periods we researched since 2005 (when data for the Microcap Index became available and a full market cycle in our view). Compare this to large-cap investing. Today, the P/E of the S&P 500 is 25. With so many eyes on each of the 500 companies there is little room for inefficiencies. And with only 500 names to choose from, the index’s P/E of 25 is more truly reflective of that investable universe. As expected, it is a much more normal distribution.
Active micro-cap managers have a significant opportunity to focus on investments that can potentially provide much greater upside than the index as a whole. Over full market cycles, it is this skill of separating the potential gems from the crowd that makes quality managers endure.
In summary, Micro-cap is a space that can’t be neatly summarized in one valuation number or forecast. So can we answer the question, is the micro-cap expensive or cheap? Well, maybe both: