Manager Commentary-Archive
Manager Commentary, 3rd Quarter 2015
OUR BULLISH TAKE ON SMALL-CAPS
The third quarter of 2015 started off strong for stocks, with large-cap stocks climbing more than 3 percent and small-cap stocks climbing more than 1 percent in the first two weeks of July, but that rally quickly faded. As measured by the S&P 500 Index, large-cap stocks lost 6.44 percent in the third quarter and small-cap stocks fared much worse. As measured by the Russell 2000 Index, small-cap stocks lost 11.92 percent and the Russell Microcap Index declined by 13.78 percent. While each of the Perritt Fund’s products performed better than their respective benchmarks, the investment losses are disappointing. However, there are several reasons to be positive, particularly for small-cap stocks.
According to Furey Research Partners, “whenever small-cap stock returns have been this poor in the third quarter, fourth quarter returns and even forward 6-month returns have been positive. Since 1940, excluding third quarter 2015, there have been 11 other years in which small-cap stocks were down 10 percent or more in the third quarter.* On 10 of those 11 occasions, small-cap stocks posted positive returns in the fourth quarter. Another bullish supporting point, the average bull market lasts seven plus years while the current bull market is only 6 years old.” While the past behavior of the market can’t predict the future, we believe the recent declines present an attractive entry point for new investments.
BEARS ARGUE ELEVATED MARGINS CREATE VALUATION DISTORTION
But…small-cap margins are far from peak levels while elevated large-cap margins can make M&A easier.
 (Click for larger image)
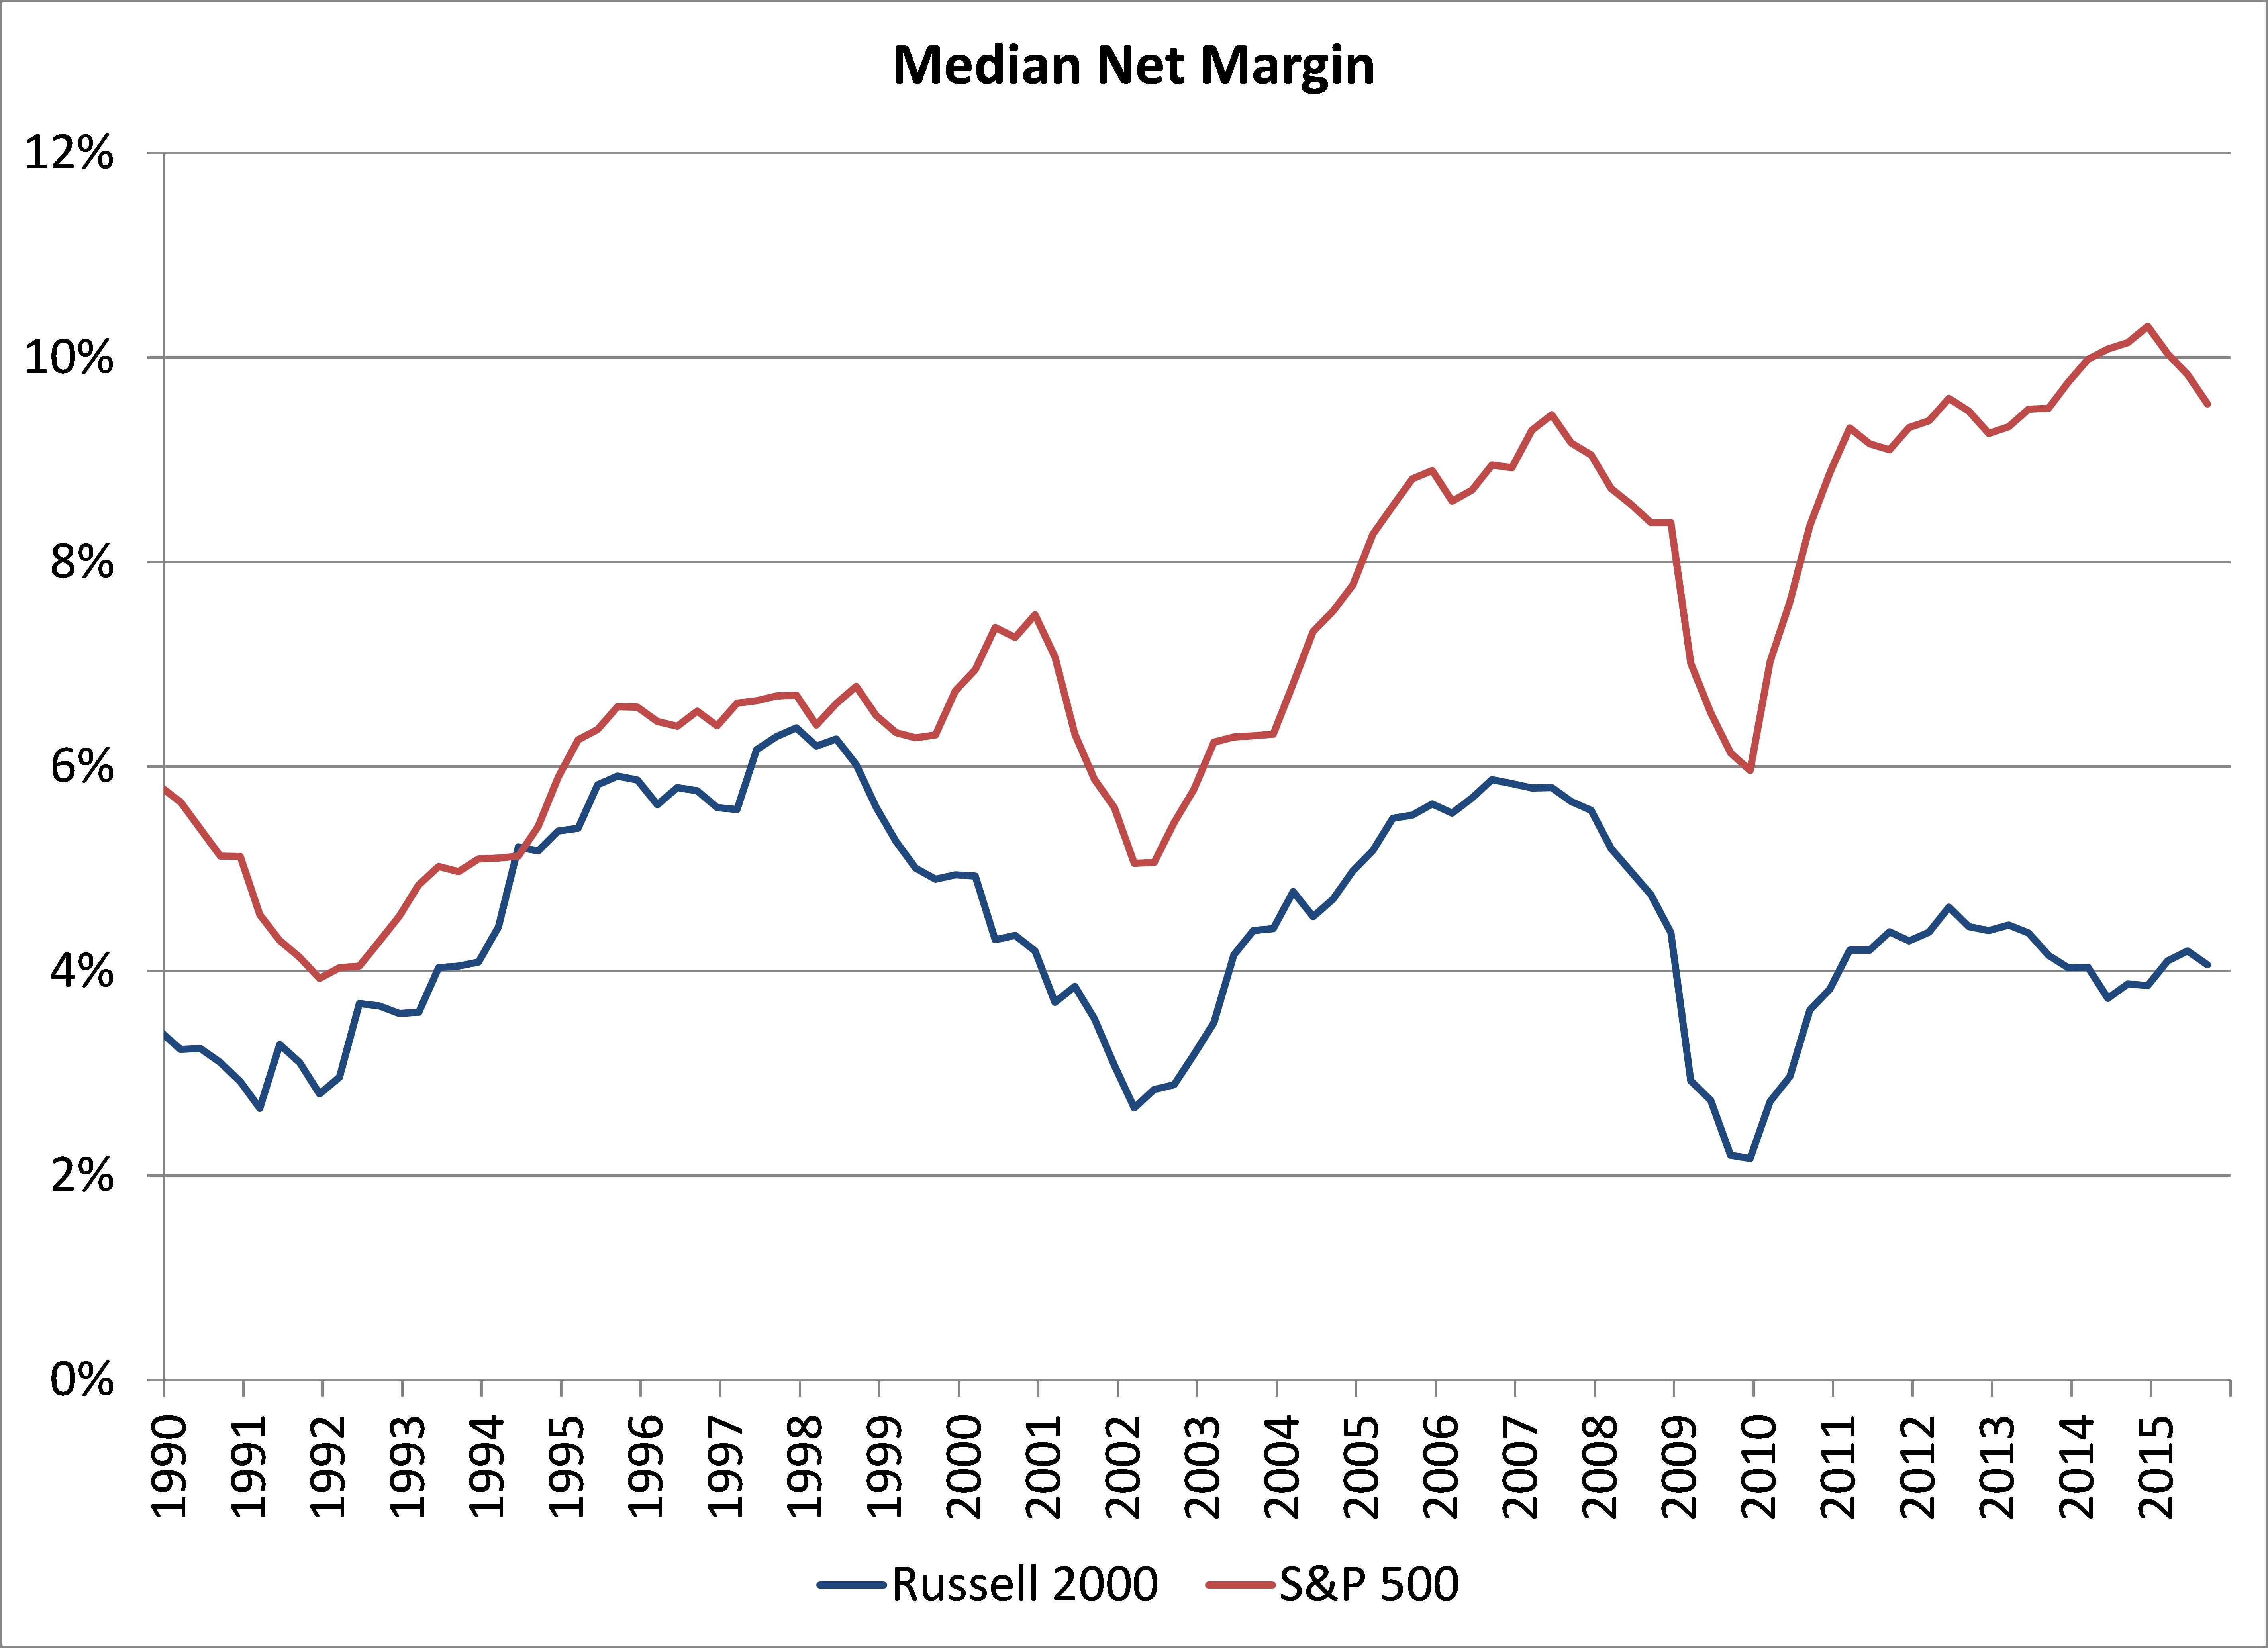
Bears have often argued that net margins are too high and normal competitive pressures should bring net margins lower. As can be seen in the graph, large-cap stock’s net margins have climbed significantly in the past few years, and even since the early 1990’s. While net margins have modestly improved in the past few years for small-cap stocks, they have been stagnant for the past two decades. We believe net margins have not improved for smaller-cap stocks due to their business investments. In fact, capital expenditures have been rising significantly for the average company within our MicroCap Opportunities Fund. We will outline this interesting fact in a new white paper next month. Please stayed tuned.
The research team at Perritt Capital Management just finished putting together our Perritt Small-Cap Insights, a comprehensive report with more than 50 slides of charts and tables detailing our positive outlook for small-cap stocks. Here we present a few charts from that comprehensive report. E-mail Mark Oberrotman – mark@perrittcap.com, or call 800-331- 8936 if you would like to see the full deck of slides.
As we mentioned in one of our commentaries last year, we believe small-cap stock indexes did not reach the full definition of a bear market, but micro-cap stocks did experience a stealth bear market. A stealth bear market is one where many stocks decline by more than 20 percent, but the index has not declined by more than 20 percent. Once again, the Russell 2000 Index and the Russell Microcap Index have not reached the bear market definition this year, but the average stock is in a bear market. There are 1,681 stocks in the Russell Microcap Index, and 1,051 of the companies declined more than 20 percent from their highs. In fact, the average decline of these 1,051 companies is 32.5 percent. While this performance is certainly discouraging, historically some bear markets have not lasted more than two years.
SMALL-CAP RELATIVE MARGINS AT CYCLICAL LOW?
- Margins have accelerated faster in large-cap companies than small-cap companies, helping to boost large-cap earnings
- Large-cap margins recently hit a peak relative to small-cap margins
- At previous peaks, small-cap margins have improved relative to large-caps, helping to drive small-cap out-performance cycles
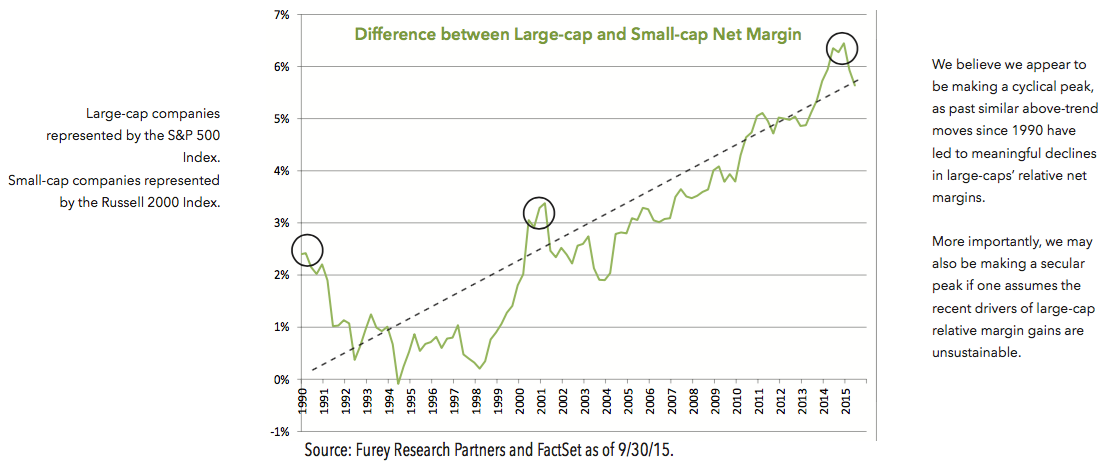
The next chart is more evidence that small-cap stock margins could improve in the near future. This chart shows the rela- tive net margins of large-cap stocks to small-cap stocks. We believe that large-cap stocks are making a cyclical peak, as past similar above-trend moves, since 1990 have led to meaningful declines in large-caps’ relative net margins. Our research and conversations with small-cap stock management teams also leads us to believe that net margins should improve for smaller stocks.
Large-cap margins have been rising relative to small-caps for nearly 25+ years, but can this continue?
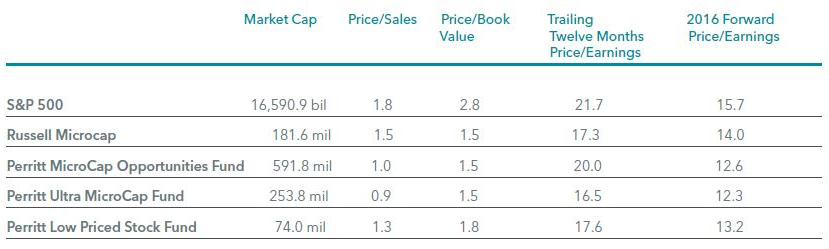
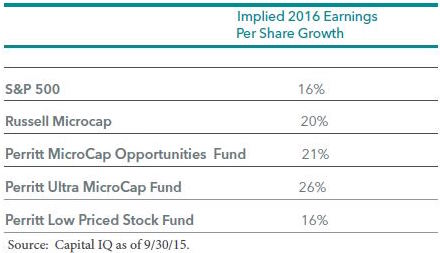
The final chart is one of our favorites. These two tables below not only show that small-cap stocks are less expensive than large- cap stocks, we believe they also should have the strongest earnings growth over the next few years. For example, the price-to sales ratio for the S&P 500 Index is 1.8 versus 1.5 for the Russell Microcap Index. In addition, each of our Funds are more attrac- tively priced based upon price/sales relative to that of Russell Microcap Index. The price-to-book value ratio and forward price earnings ratio of the Russell Microcap Index and our funds are more attractive than S&P 500 Index. Finally, the implied 2016 earnings per share growth for small-cap stocks are much stronger than large-stocks. For example, the Russell Microcap Index has an implied earnings growth of 20% vs. the S&P 500 earnings growth of 16%.
SMALL CAPS VS. LARGE CAPS: WHERE CAN INVESTORS FIND GROWTH?