Manager Commentary-Archive
Manager Commentary, 3rd Quarter 2012
Q: How Might the Most Recent QE Announcement Affect Micro-cap Equities?
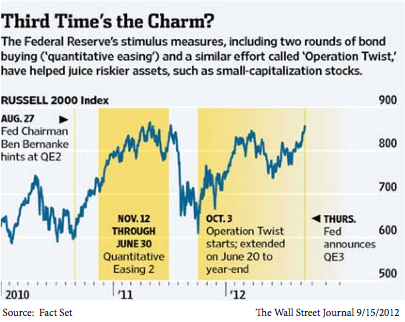
A: As most investors know, part of the underlying goal of continued QE is to push investors toward “riskier assets.” Measured by this metric, Bernanke has been somewhat successful despite the fact that investor assets have continued to pour into U.S. Treasuries. As seen in the table below, QE corresponds closely with positive returns for the Russell 2000 index. While QE continues it is reasonable to believe that this trend might persist, indicating a strong environment for small- and micro-cap companies.
An analysis of how small and micro-cap stocks respond to the rise and fall of inflation expectations provides us added valuable insight. These market-determined expectations have perhaps played a large role in investor behavior during the new, post-crisis/zero rate environment. We will be publishing a white paper early next month, Observations of Inflation Expectations’ Effect on Risk Assets in the Post-Crisis Period, analyzing the distinct periods of rising and falling inflation expectations over the past four years. We have found that since reaching the zero bound for interest rates the old ways of viewing inflation’s effect on stock prices has been turned upside down. In summary, higher inflation expectations have been good for risk assets generally and for small- and micro-cap stocks in particular. We believe that advisors and shareholders should continue to monitor investor expectations of inflation closely when measuring opportunity in the small and micro-cap sector. We certainly recommend all of our clients take a look at the white paper when it is released and we encourage your thoughts and feedback.
We will be publishing a white paper, Observations of Inflation Expectations Effect on Risk Assets inthe Post-Crisis Period, which demonstrates that since reaching the zero bound for interest rates, the old ways of viewing inflation’s effect on stock prices has been turned upside down.
Q: With Financials And Biotech Continuing To Drive Index Returns, Why Do You Remain Confident In Cyclical Companies?
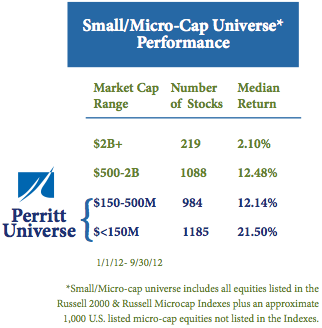
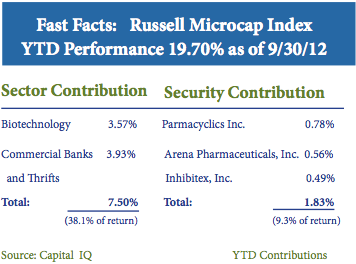
A: As we detailed in our previous commentary, the return of the Russell Microcap Index has been concentrated in a small number of Biotech, Regional and Thrift Banking stocks. This trend continued in the third quarter, as can be seen in the table below. Despite this, we are significantly underweight the Financials and Healthcare sectors be- cause of our strong conviction that the greatest upside opportunity in the micro-cap space can currently be found in cyclical companies.
“We believe that the low upside offered by financials is far less compelling than the earnings-power opportunities we see in cyclical companies today.”
To take a closer look at the level of upside potential found in typical cyclical company in our portfolio we point to Integrated Silicon Solutions (ISSI). This company produces semi-conductors for high-margin, customizable electronics products. Annual revenue is $265 million, the firm holds $100 million in cash with no debt on the balance sheet, and the market capitalization is $248 as of 9/30/12. Like many cyclical investments in the small- and micro-cap space, investors have shown no interest in business growth and fundamentals and have failed to do their homework to understand the story. ISSI has been lumped in with more commoditized chip manufactures despite its move towards high margin, more customized products and applications, a classic example of the baby being thrown out with the bath water. What we believe investors will eventually realize is the fact that ISSI trades at a P/E of 6.2 after netting out cash. To demonstrate the potential upside, ISSI would be priced in the mid $20 range based on forward earnings of $1.00, a 19.8% ROE and cash on the balance sheet.
Attribution Analysis
Click here for standardized fund performance.
Performance data quoted represents past performance; past performance does not guarantee future results. The investment return and principal value of an investment will fluctuate so that an investor’s shares, when redeemed, may be worth more or less than their original cost. Current performance of the fund may be lower or higher than the performance quoted. Performance data current to the most recent month end may be obtained by calling 1-800-331-8936. The funds impose a 2% redemption fee for shares held less than 90 days. Performance data quoted does not reflect the redemption fee. If reflected, total return would be reduced.
- The MicroCap Opportunities Fund gained 3.99% versus 5.25% for Russell 2000 Index and 5.92% for the Russell MicroCap Index during the second quarter. YTD the fund is up 13.70% versus 14.23% and 19.70% for the Indexes, respectively.
- Strength in both the Financial and Healthcare sectors detracted from our relative performance due to our significant underweight to those two industries as discussed previously. Nearly 40% of the return of the Russell Microcap Index YTD has been concentrated in a small number of Biotech, Regional and Thrift Banking and stocks
- Stock selection in total attributed 4.63% to relative returns versus the Russell 2000 Index YTD and 4.45% for the quarter. Relative to the Russell Microcap Index selection attributed 1.21% YTD and 2.5% for the quarter. Seven of the Fund’s nine equity sectors attributed positive stock selection, including strong selection in both the Financials and Healthcare sectors which were in fact the top two sector contributors based on stock selection.
- The Ultra MicroCap Fund gained 0.96% versus 5.92% for the Russell MicroCap Index during the second quarter. YTD the fund is up 9.70% versus 19.70% for the Index.
- We stress again the difficulty of contrasting this fund to a benchmark as it invests in companies far below the traditional radar, as demonstrated by its average market capitalization of just $50.6 Million (the lowest of all 8,145 domestic equity Funds, according to Morningstar as of 10/23/12)
- Like the MicroCap Opportunities Fund, the Ultra MicroCap Fund’s overweight to cyclical industries such as technology and energy detracted from relative performance.
- Relative performance impact was mixed as five of the Funds ten equity sectors contributed positively to performance. However, negative contributions from Energy, Healthcare and Materials outweighed gains achieved elsewhere.