

Manager Commentary-Archive
Manager Commentary, 3rd Quarter 2011
Numbers Don’t Lie: A Disappointing Quarter, Compelling Opportunity?
If we believe that numbers don’t lie, then our words shouldn’t either: we are disappointed with our recent performance. Yet cold, hard numbers can teach us a lot, especially in an environment being dominated by emotion. In this commentary we will keep the words short and focus on the data. What can it tell us about the recent downturn? And where is the opportunity?
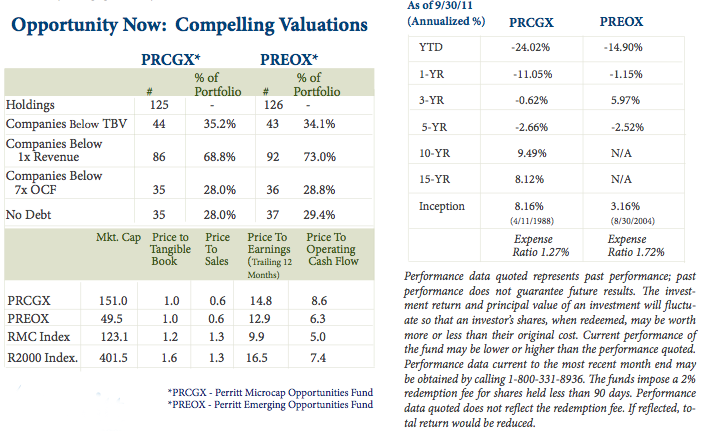
The extreme volatility in the microcap space was caused by a rush to liquidity by investors of all kinds. Fearful investors shunned the stocks that were less likely to be able to provide them with short term cash and they placed a premium valuation on more liquid, defensive names. The result was that poor performance has been most pronounced in the lower marketcap stocks, as seen in the adjacent table. Because we invest primarily in the sub-$500 million market cap range, the companies that we invest in were adversely affected.
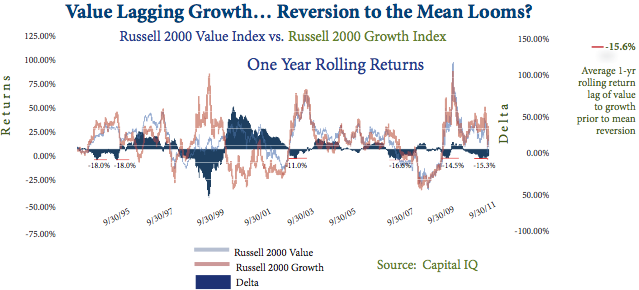
Value stocks have lagged growth stocks in the small-cap space this year, although this trend has been slightly reversing. In the past twenty years, The Russell 2000 Value Index has lagged the Russell 2000 Growth Index in seven distinct periods outside of the Technology Boom of the late 90’s, which can be viewed as somewhat of an anomaly. In each of the seven periods, the Value Index lagged the Growth Index by an average of 15.6% on a one-year basis before a predicable reversion to the mean occurred. In April of this year, the one-year return of the Value index lagged the Growth Index by 15.8%. As expected, since that time small-cap value stocks have outperformed. We tend to invest with an emphasis on solid fundamentals and clean balance sheets and we prefer to not pay for a price-to-earnings growth (PEG) ratio of over 1.0 for a growing company. Because of this, the relative outperformance of growth stocks has hurt our portfolio on a year-to-date and one-year basis, although it is encouraging that this trend is slightly reversing as might be expected.
Short Term Volatility… Long Term Track Record
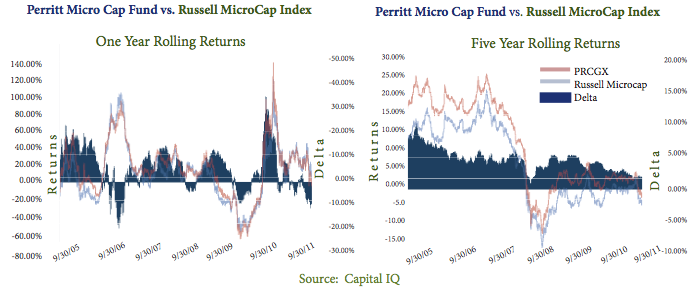
We know that the best way to measure performance is over a full market cycle. Despite being disappointed with our recent short-term performance, we do remember that we have been here before. We are confident about the future because our five-year rolling returns (shown below)* confirm that our shareholders have profited relative to the Index despite short term volatility.
Our twenty years of experience investing over multiple market cycles has taught us that it is difficult – if not impossible – to predict the moment when a short-term trend in under-performance of a market segment or a skilled manager reverses itself. However, portfolio valuations have often provided a good forecast. Many of the stocks in our portfolio have been a victim of indiscriminate selling regardless of balance sheet fundamentals or business performance. We hope that the valuation data and examples that follow will give you an insight into the earnings power and upside opportunity in our portfolios that are currently being ignored by Wall Street.
During the third quarter both the sector allocation and the stock selection hurt the performance of the Microcap Opportunities Fund. Much of the under performance was due to our significant underweight in Financials relative to the benchmark*.
The Fund has historically been significantly underweight in Financials and we expect that trend will continue as the number of high-quality financial companies in the micro-cap space is limited. However, despite our large underweight to the sector, we have lately increased our allocation to Financials as we have seen several attractively priced and compelling opportunities in the sector lately, mainly in asset managers and some regional banks.
Year-to-date, over half of the MicroCap Opportunities Fund’s relative under performance was due to our selection in the Technology sector. As explained in the beginning of this commentary, much of this had to do with a general flight to liquidity as investors abandoned micro-cap stocks. There was a large amount of selling focused on the more volatile Technology space, and on our lower market caps names in particular. We remain convinced about the long-term prospects of many micro-cap companies in the technology space because the strength of balance sheets in relation to stock prices is as attractive as we have seen in many years.
Stock selection was the reason that The Emerging Opportunities Fund outperformed its benchmark in the quarter as well as on a year-to-date basis. The Fund was driven by outperformance in stocks of nearly every sector. Selection was particularly strong in the Health Care sector, aided by the buy-out of two companies (American Medical Alert Corp. and Allied Healthcare International) at a significant return. Whether lucky or good, we are well-aware the kinds of “nano-cap” companies we invest in do march to the beat of their own drum and that making short-term comparisons to a benchmark can be something of a ridiculous exercise. As our clients know, we have good reason to believe this Fund is a truly distinctive offering which gives investors exposure to the very smallest of the small companies.