Manager Commentary, 2nd Quarter 2017
2nd QUARTER REVIEW
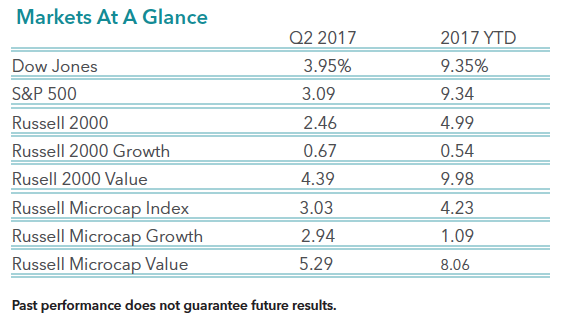
The second quarter performance for the stock market was very much like the first quarter performance. Large stocks performed well and growth stocks outperformed value stocks. The table below details the performance for large stocks and small stocks for both the second quarter and year-to-date.
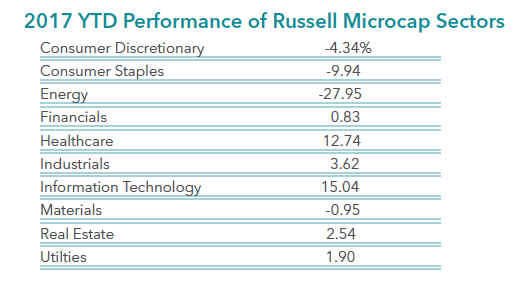
Whether it is large stocks or small stocks, technology and healthcare stocks continue to dominate the performance charts. The table below provides the performance results for each sector within the Russell Microcap Index. As you can see, technology and healthcare stocks were the only stocks that produced double digit returns through the first six months of the year. It has been a very poor period for consumer and energy stocks, as they declined significantly during the past six months.
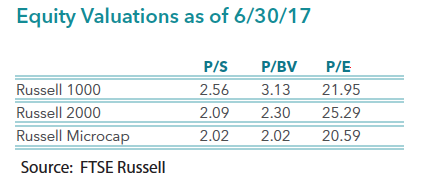
While the equity markets have performed well in the past six months, most of the gains are attributable to multiple expansion. As fundamentalist, we would prefer to see decent revenue and earnings growth along with strong price appreciation. We, and many other strategists, believe earnings growth will improve dramatically in the next year or two. This confidence in future earnings growth makes us believers in this bull market. However, valuations across the marketplace are starting to look rich. The next table below outlines three valuation measures for the large cap Russell 1000 Index and the small stock Russell 2000 Index and the Russell Microcap Index. While not at peak valuations levels, these multiples are lofty relative to anytime in history.
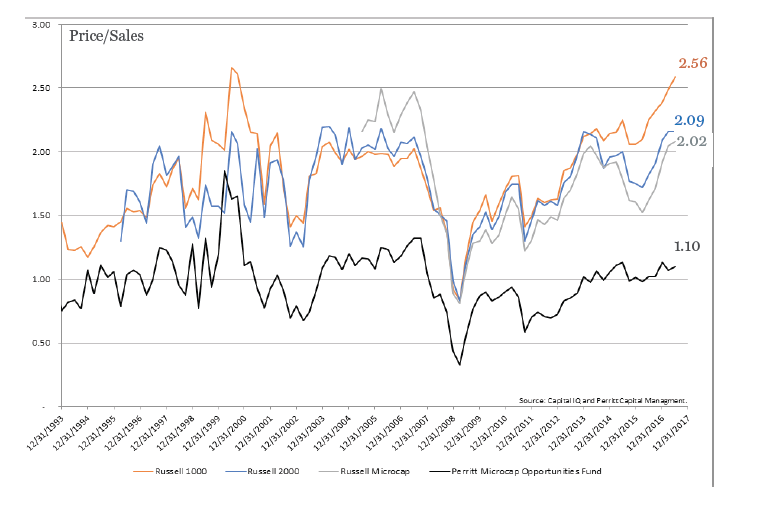
The chart below shows the historic price-to-sales ratio of each index we reviewed above, as well as the historic price- to-sales ratio for our flagship MicroCap Opportunities Fund. As you can see, large cap valuations on this chart have been going straight up for about a year and a half, and are now at peak valuations. The Russell 2000 and the Russell Microcap Indexes are near peak valuation levels too, but remain well below the valuations of the large-cap Russell 1000 Index. While our MicroCap Opportunites Fund has almost always traded at lower valuation levels than that of the market indexes, the Fund is now trading at the widest discount to the indexes in 24 years. This valuation discount gives us confidence in our portfolio of companies versus that of the rest of the market. (The current P/S ratios for the Perritt Ultra Microcap and Low Priced Stock funds are also significantly lower than the market at 1.16 and 1.39 respectively.)
The information provided herein represents the opinion of Perritt Capital Management and is not intended to be a forecast of future events, a guarantee of future results, nor investment advice.
Mutual Fund investing involves risk. Principal loss is possible. The Funds invest in smaller companies, which involve additional risks such as limited liquidity and greater volatility. The Funds invest in micro-cap companies, which tend to perform poorly during times of economic stress. The Ultra MicroCap Fund and Low Priced Stock Fund may invest in early stage companies, which tend to be more volatile and somewhat more speculative than investments in more established companies. Low Priced stocks are generally more volatile than higher priced securities.
Price/Sales (P/S) compares a company’s stock price to its revenues. Price/Book (P/B) is a financial ratio used to compare a company’s stock price to its book value. (P/E) is short for the ratio of a company’s share price to its per-share earnings. Ttm P/E is the trailing twelve months P/E. Dow Jones Industrial Average is a price weighted average of 30 significant stocks traded on the New York Stock Exchange and the NASDAQ. S&P 500 Index is an index of 500 stocks seen as a leading indicator of U.S. equities and a reflection of the performance of the large cap universe. Russell 2000 Index is an index that measures the performance of approximately 2,000 small-cap companies in the Russell 3000 Index, which is made up of 3,000 of the biggest U.S. stocks. Russell 2000 Growth Index measures the performance of companies within the Russell 2000 Index having higher price-to-book ratios and higher forecasted growth values. Russell 2000 Value Index measures the performance of companies within the Russell 2000 Index lower price-to-book ratio and lower forecasted growth values. Russell Microcap Index is a capitalization weighted index of 2,000 small-cap and micro-cap stocks that captures the smallest 1,000 companies in the Russell 2000, plus 1,000 smaller U.S.-based listed stocks. Russell Microcap Growth Index measures the performance of those Russell Microcap companies with higher price-to-book ratios and lower forecasted growth values. Russell Microcap Value Index measures the performance of those Russell Microcap companies with lower price-to-book ratios and lower forecasted growth values. Return on Invested Capital (ROIC) is a calculation used to assess a company’s efficiency at allocating the capital under its control to profitable investments.
Earnings Growth is not a measure of the Fund’s future performance.
Past performance does not guarantee future results. Index performance is not indicative of fund performance. To obtain fund performance, click here www.perrittcap.com/funds/
One cannot invest directly in an index.
Click here for a current prospectus. Fund holdings and sector allocations are subject to change at any time and should not be considered a recommendation to buy or sell any security. Click here for the Funds’ top 10 holdings: PLOWX, PREOX, and PRCGX.

