Manager Commentary-Archive
Manager Commentary, 2nd Quarter 2015
“I Wish I Knew Then What I Know Now.”
You can learn a lot about investing in three years, even when you’ve been at it for more than two decades. This past June our original shareholders in The Perritt Low Priced Stock Fund (PLOWX) celebrated a three-year track record. As the lyric above conveys, if we were to do it all again, we would change a few things (launch the Fund in 2009, for example). But there is a certain excitement that youth brings, and the Fund’s first three years were no exception.
Along with its three-year anniversary, The Perritt Low Priced Stock Fund (PLOWX) was named Category King in The Wall Street Journal as of 6/30/2015 amongst Small Cap Core Funds, based on Lipper data. The Category King award recognizes the top 10 funds of each category for one year total returns.
MORE CONCENTRATED POSITIONS
In our twenty-plus year history investing in micro-cap companies, we’ve always understood that it is necessary to invest across a diverse portfolio of one-hundred or more micro-cap names. Companies of this small size are often dependent on a single product line or single customer so one negative news event can cause a swift market reaction. Broad diversification can potentially safeguard portfolio assets from downturns and keep us ready to jump on new opportunities. As you go up the market-cap scale into low priced/small-cap companies, this risk is reduced, allowing us to allocate more to our proven ideas.
80/20 RULE
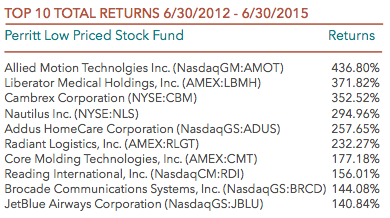
The 80/20 rule – 80 percent of your return comes from 20 percent of your ideas – is a phenomenon that we have experienced across all of our strategies. The fact that a low-priced stock strategy allows for a more concentrated positioning has enhanced results. Below are the ten best performing investments in the fund since inception, which have certainly helped drive portfolio returns.
“Along with its three- year anniversary, The Perritt Low Priced Stock Fund (PLOWX) was named Category King in The Wall Street Journal.”
STOCK SELECTION
Our firm’s investment process is based on an ability to find under-followed companies that provide compelling stories, growing businesses, and attractive valuations. A case study in stock selection is 1-800-Flowers (FLWRS), a top contributor to fund performance in 2015. 1-800-Flowers is well-known to most consumers (show someone you’re thinking of them now, you can thank us later). The stock was something of a fallen angel from its tech-fueled heights in the late 90s. In fact, business has increased four times from what it was in 1999, yet the stock still sits below its peak. What attracted us to FLWS was its management’s clear vision to leverage strong brands to make 1-800-Flowers.com a prime destination for online gift-giving of all sorts. Management began purchasing brands, such as Fannie May Chocolates and the Popcorn Factory to add to its stable of baskets, fruits, and other products. A true catalyst for FLWS was the purchase of Harry and David gourmet gifts brand, which we felt was at a bargain price of less than 6x EBITA and immediately accretive. The market agreed, and the stock grew from $5.00 to $12.00 in less than a year.
NIMBLE LIQUIDITY
We believe the “illiquidity premium” is a compelling reason why investors should add micro-cap equities to their portfolio. We will strive to reward our investors willing to accept the illiquidity inherent in micro-caps. Frankly, we’ve built our firm on this idea.
However, as you climb the market-cap scale from micro- to small-cap, we believe there is a certain value to be found in trading illiquidity for agility. Seeking larger market-cap names opens trading doors to more opportu- nistic and strategic moves. In the FLWS example above, we were able to trade around this position following the merger anouncement, as the stock soared from $5.00 to above $12.00, where we sold part of our position, before falling back to below $10.00 where we bought shares again. Shorter term tactics are not a significant part of our investment process, but in this example they did allow for one of the highest-contributing names during the year.
We are proud that we can now offer our shareholders a fund option with a track record of 20-plus years (PRCGX), 10-plus years (PREOX), and now 3-plus years (PLOWX). We look forward to many more decades of investing, and we ask that you join us!
VALUATIONS: THE “OVER-RICH” GET RICHER
The Perritt Low Priced Stock Fund’s success in 2015 has been something of an anomaly in an environment that has favored passive indexes. The Perritt MicroCap Opportunities Fund has certainly suffered from this trend, as returns have lagged the Russell Microcap Index. The Perritt Ultra MicroCap Fund – recently named to the Charles Schwab Mutual Fund OneSource Select ListTM– in our opinion has no true benchmark that can provide accurate comparison based on its characteristics. It continues to march to its own drum, as seen by its market capitalization of $77M and r-squared of 0.30 as of 6/30/15. This indicates how the companies in the portfolio are extremely small and have low correlation to the market.
“Our firm’s investment process is based on an ability to find under-followed companies that provide compelling stories, growing businesses, and attractive valuations.”
A single chart below shows why 2015 has been a difficult year for active small/micro-cap managers. Simply put, companies in the Russell 2000 Index with negative EBIT have provided twice as much return as those with positive earnings. Companies with no earnings have provided 13.0% return in 2015 as compared to just 6.3% for compa- nies that are actually making money. Readers of our recent commentaries won’t be surprised to hear that the bulk of the Index returns are being provided by Biotech companies which would be unlikely to pass close analysis of an active manager.
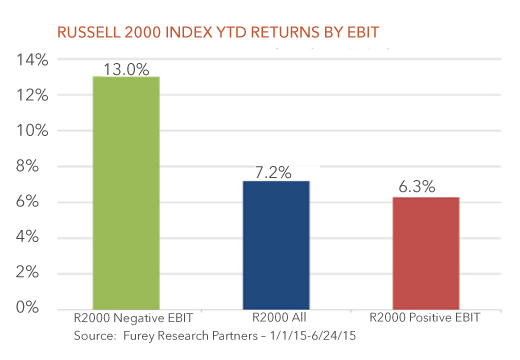
“Companies in the Russell 2000 Index with negative EBIT have provided twice as much return as those with positive earnings.”
The trend of negative EBIT companies driving performance is similar when you look at the Russell Microcap Index, which is even more concentrated among a few high-flying names. Biotech stocks in the Russell Microcap Index contributed to 3.9% of the Index’s 6.0% performance YTD (equivalent to 65% of the YTD return), influenced by a very narrow group of holdings (the top 10 contributing Biotech stocks made up a full 2.6% of the Index return). Given the lofty valuations of the sector, we believe the Biotech companies that may succeed are priced for perfection, the rest are priced for disaster. We saw a glimpse of this devastation with the recent blowups of Sunesis Pharmaceuticals, Inc. (SNSS) loss of 77% in one day and XOMA Corp. (XOMA) loss of 71% also in one day following disappointing trial results/FDA rulings.
We may not know when this trend will turn, but in our two-decades of small-cap investing, we have seen similar periods. When the most profitable and well-run companies are the least favored by the market, opportunities may become plentiful for active managers who have diligence and patience. Negative EBIT companies cannot be the small/micro-cap leadership group forever.
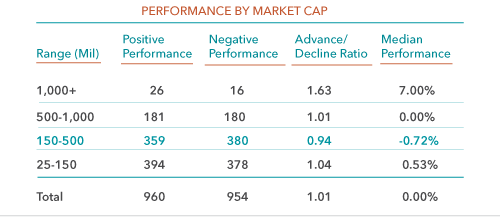
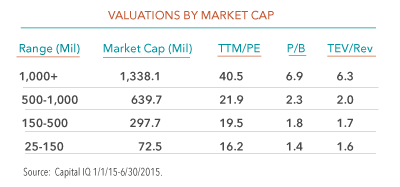
The charts below show performance and valuations according to company size. As seen, the larger the company, the stronger the performance so far in 2015. We believe valuations point to the most compelling opportunities in the smaller-market cap segment of the universe.