Manager Commentary, 1st Quarter 2019
LAND OF THE UNICORNS
There is a herd of unicorns prancing through Wall Street and the bulk of money is chasing them. A “unicorn” refers to a startup, usually venture-backed, that achieves a private valuation in excess of $1 billion whether they are profitable or not when they become public. What once seemed impossible is commonplace today. The two king unicorns are Uber, the $1.8 billion money losing taxi company, which could go public next month with a value of $120 billion, and Lyft, who lost $911 million in 2018 and had a valuation of $20 billion upon their offering.
The estimate for upcoming offerings in 2019 is $80 billion which is double the yearly average since 1999. Historically, peaks in IPOs have indicated the top of the stock market and a precursor to recession. Both 1999 and 2007 were very strong years for IPOs leading to nasty bear markets thereafter.
The proportion of companies reporting losses before going public in the U.S. is the highest since the dot com boom in 2000. Of the companies that went public in 2018, +80% of them were unprofitable. And of the 100+ companies to complete an IPO since 2010, 64% were unprofitable. As can be seen from the chart below, the Russell 2000 loss-making companies outperformed profitable ones by more than 600 basis points (bps) in the first half of 2018 and are doing so by more than 700 bps so far in 2019. The unprofitable companies in the Russell Microcap Index outperformed the profitable ones by 420 bps.
Back to the Future…1Q19 Performance Mirrored 1H18
Loss-Makers surged again in 1Q, with Biotech and Software leading the way
Loss-making companies in the Russell 2000 are Outperforming in ’19 as they did in 1H’18
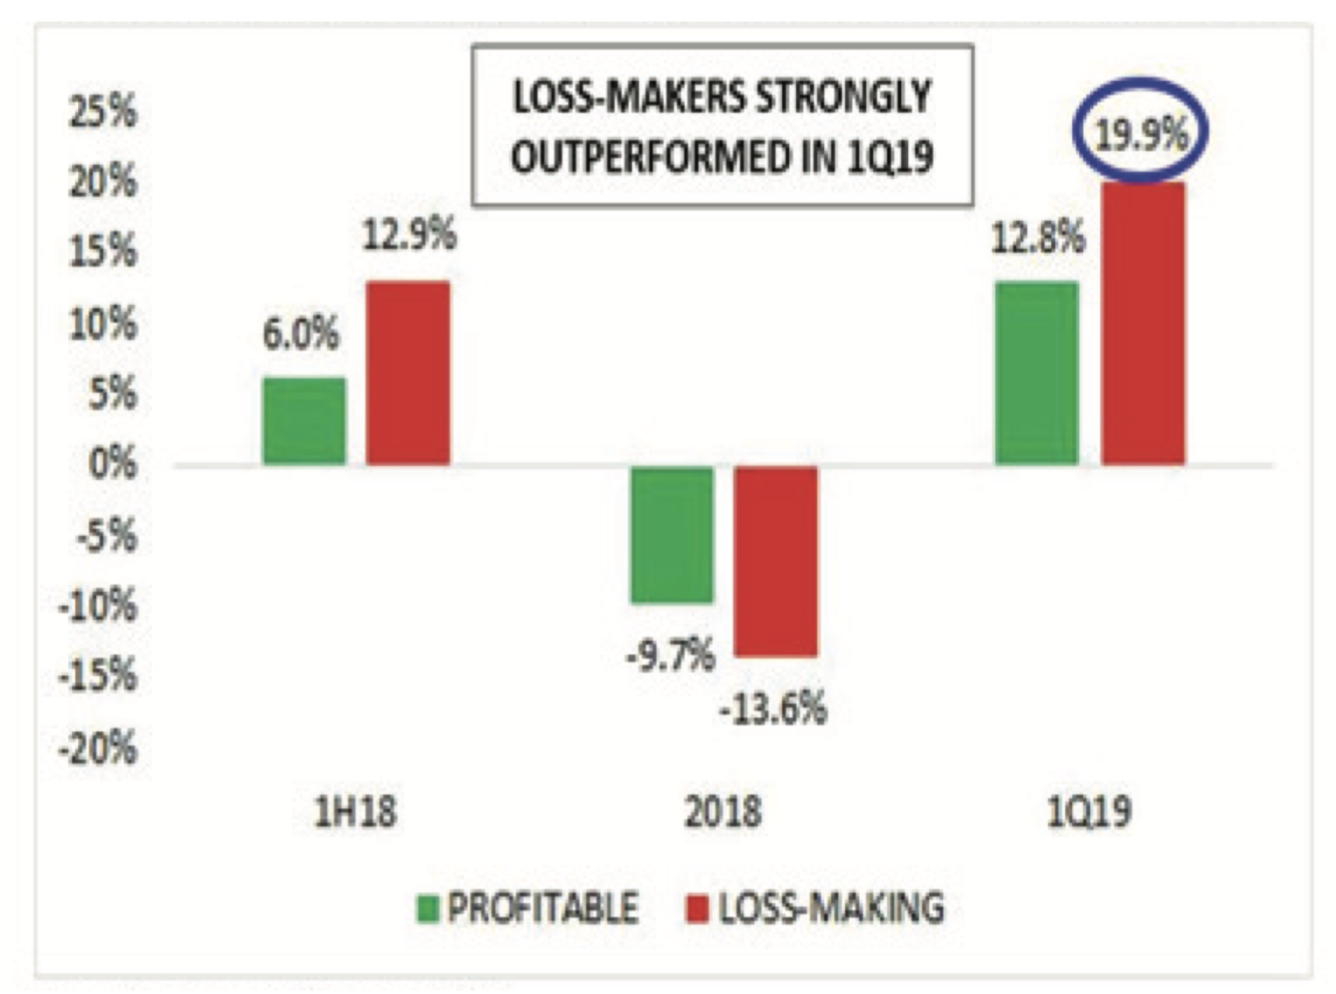
Source: Furey Research Partners and FactSet.
There is a great amount of money going into these IPO stocks leaving little for the rest of the market. Investors are dumping shares of established, profitable companies to buy these new stocks. The question being asked is if value investing is dead. Since 2010 with the start of quantitative easing and its impact on the yield curve, we have seen growth companies have an advantage over value. This has been the longest, broadest period of loose monetary policy and consequently the longest period of underperformance by value stocks. In the first quarter of 2019 alone the Russell 2000 Growth Index rose 17.14%, or 521 bps better than the Russell 2000 Value Index which gained 11.93%. Value stocks have beat growth stocks by 4% each year between 1926-2008, but growth stocks are currently enjoying their longest rally on record, having been the place to be ever since global stock markets bottomed out in early 2009. The chart below gives a better picture of how long growth has been outperforming value in this current period. While we clearly don’t know when the tide will turn for value, it seems clear to us that we are closer to the end of growth’s dominance than the beginning.
Growth Has Outperformed Value Six Times Since 1945
Each Time Value Has Had A Significant Recovery*
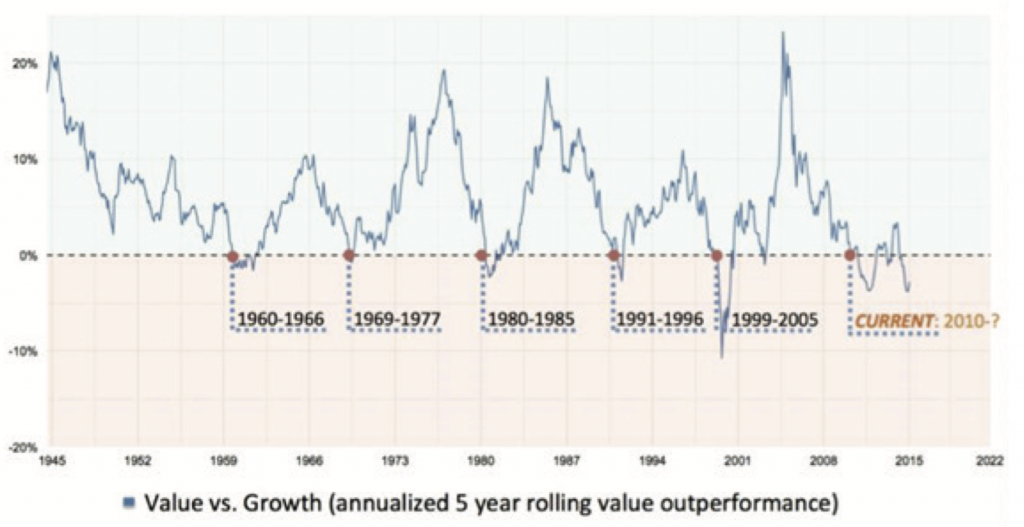
All performance information is hypothetical and not the actual performance of an investment fund. Historical performance is not necessarily indicative of future performance. The data used in this study is publicly available and can be accessed at http://mba.tuck.dartmouth.edu/pages/faculty/ken.french/data_library.html
* Data from Kenneth French, the Fama/French benchmark. Portfolios are rebalanced quarterly using two independent sorts, on size (market equity, ME) and book-to-market (the ratio of book equity to market equity, (BE/ME). The size breakpoint (which determines the buy range for the Small and Big portfolios) is the median NYSE market equity. The BE/ME breakpoints (which determine the buy range for the Growth, Neutral, and Value portfolios) are the 30th and 70th NYSE percentiles.
Long periods of underperformance are par for the course with value investing, but the length of the current period means value managers are almost extinct. David Einhorn, a famous value investor who has seen his assets go from $12 billion to $5.5 billion, has questioned if equity value has nothing to do with current or future profits. Might it instead be derived from a company’s ability to be disruptive, to provide social change, or to advance new beneficial technologies, even when doing so results in current and future economic losses? A reminder of other “disruptive technologies” that failed might be helpful. The automobile was perhaps one of the first disruptive technologies. In Michigan state alone, there are 175 defunct auto companies. Remember Blockbuster, Napster, Nokia, Kodak, Betamax? We would argue that there is still a very valid place for value investments, especially small/micro cap value stocks.
Let’s look at one last chart. Our friends at Furey Research developed this chart. It shows the relative PE of the Russell 2000 to the S&P 500 Index. We have often argued that this current period reminds us of the late 1990’s, a period where valuations and fundamental investing was abandoned by most investors. The net result in the late 1990s was that investors left small/micro cap value stocks for dead, and valuations became incredibly cheap for small/micro-cap stocks. Once again, the chart below gives us confidence that small/micro-cap value stocks may be closer to the end of their underperformance cycle.
Despite the Strong Quarter, Relative Valuation Remains Compelling
Relative to large-caps, small caps appear increasingly attractive
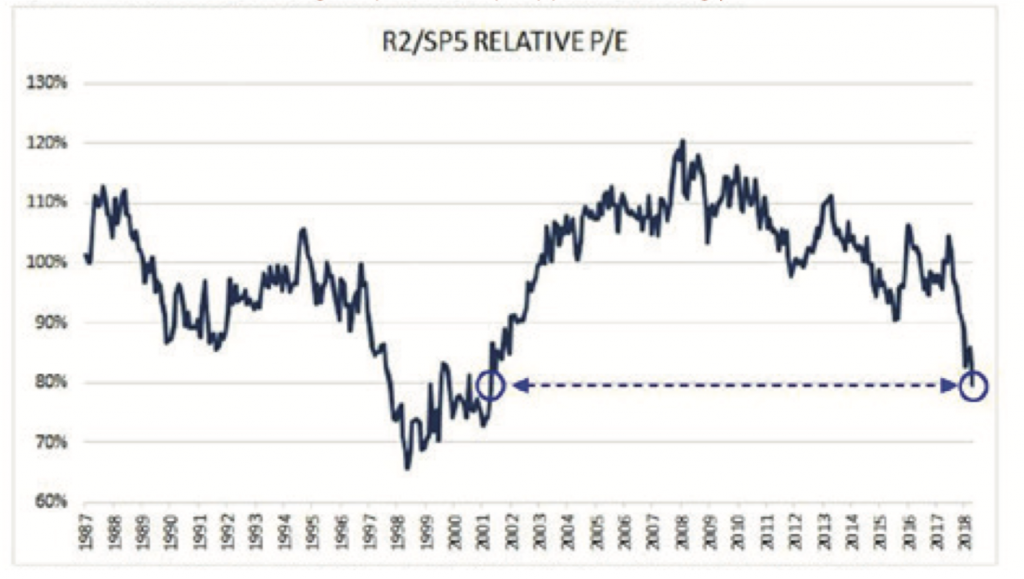
Source: Furey Research Partners and FactSet. Data as of 1/29/19.
Represents median P/E using latest available 12-month earnings.
IN THE NEWS…
BioScrip (BIOS) and Option Care Enterprises have entered into a definitive merger agreement. This combination is expected to create a leading independent provider with the national reach, comprehensive therapy offering and financial capacity to succeed in the attractive and growing home and alternate site infusion services segment of the $100 billion U.S. infusion market.
Check-Cap (CHEK) Check-Cap, a clinical-stage medical diagnostics company advancing the development of C-Scan, the first and only preparation-free capsule based screening method of prevention of colorectal cancer, received approval from New York School of Medicine to begin a U.S. pilot study of the C-Scan system.
CynergisTek (CTEK) The company closed a transaction to sell the assets used in its Managed Print Services business division for $30 million. This transaction will enable the company to prioritize its core cybersecurity and privacy services.
Galaxy Gaming (GLXZ) After hiring a financial advisor to review strategic alternatives, including a potential sale of the company, Galaxy decided to continue their existing plan to significantly expand their product line and geographic area. While the review did not result in a sale of the company, we continue to believe the company may ultimately be sold to a larger casino related company.
Singing Machine (SMDM) entered into a three-year licensing agreement with CBS Consumer Products for the Carpool Karaoke concept featured in segments on The Late Late Show with James Corden. Singing Machine will be launching a range of consumer products for use within vehicles under this license. Additionally, the company continued to expand their reach international with a new distribution partnership announced for the Nordic countries.
Rockwell Medical (RMTI) announced during their earnings call that they will begin commercial sales of their Triferic iron replacement product into the dialysis market beginning in the second quarter of this year. Commercial sales of this product have been anticipated by the market for some time. The company also announced their first international approval for their dialysis treatment in Peru with further international approvals either pending or applications being submitted throughout the year.
Titan Medical (TMDI) conducted a secondary offering raising around $25 million. They subsequently announced a timeline to commercialization for the middle of 2020 initially targeting the surgical market in the gynecological space offering increase visibility on their path to revenue generation. With this raise the company believes they have the assets in place to get to market. The company also announced a collaboration with Teleflex, Inc. to integrate their surgical platform with Teleflex’s ligation system.
Zix Corporation (ZIXI) announced the acquisition of AppRiver, a leading provider of cloud-based cybersecurity solutions, for $275 million in cash. This acquisition will more than double Zix’s current revenue base.
The information provided herein is opinion and is not intended to be a forecast of future events, a guarantee of future results, nor investment advice.
Russell 2000 Index is an index that measures the performance of approximately 2,000 small-cap companies in the Russell 3000 Index, which is made up of 3,000 of the biggest U.S. stocks.
Russell 2000 Growth Index measures the performance of companies within the Russell 2000 Index having higher price-to-book ratios and higher forecasted growth values.
Russell 2000 Value Index measures the performance of companies within the Russell 2000 Index lower price-to-book ratio and lower forecasted growth values.
Russell Microcap Index is a capitalization weighted index of 2,000 small-cap and micro-cap stocks that captures the smallest 1,000 companies in the Russell 2000, plus 1,000 smaller U.S.-based listed stocks.
Russell Microcap Growth Index measures the performance of those Russell Microcap companies with higher price-to-book ratios and lower forecasted growth values.
Russell Microcap Value Index measures the performance of those Russell Microcap companies with lower price-to-book ratios and lower forecasted growth values.
S&P 500 Index is a market capitalization weighted index of the 500 largest U.S. publicly traded companies which is regarded as the best gauge of large-cap U.S. equities.
IPO, initial public offering is the very first sale of stock issued by a company to the public.
Yield curve is a line that plots the interest rates, at a set point in time, of bonds having equal credit quality but differing maturity dates.
Price/Sales (P/S) compares a company’s stock price to its revenues.
Price/Book (P/B) is a financial ratio used to compare a company’s stock price to its book value.
Price Earnings Ratio (P/E) is short for the ratio of a company’s share price to its per-share earnings.
Ttm P/E is the trailing twelve months P/E.
Basis points (bps) refers to a common unit of measure for interest rates and percentages in finance. One basis point is equal to 1/100th of 1%, or 0.01%.
One cannot invest directly in an index.
The fund’s investment objectives, risks, charges, and expenses must be considered carefully before investing. The statutory and summary prospectuses contain this and other important information about the investment company and may be obtained by calling (800) 331-8936. Read carefully before investing.
Click here for a current prospectus. Fund holdings and sector allocations are subject to change at any time and should not be considered a recommendation to buy or sell any security. Click here for the Fund’s top 10 holdings: PRCGX, PREOX.
Mutual fund investing involves risk. Principal loss is possible. The fund invests in smaller companies, which involve additional risks, such as limited liquidity and greater volatility. The fund invests in micro-cap companies which tend to perform poorly in times of economic stress.
Growth stocks typically are more volatile than value stocks; however, value stocks have a lower expected growth rate in earnings and sales.
The Perritt Funds are distributed by Quasar Distributors, LLC.

