Manager Commentary-Archive
Manager Commentary, 1st Quarter 2017
1ST QUARTER REVIEW
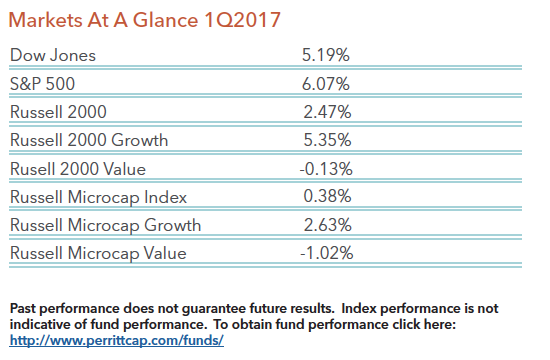
The first quarter of 2017 was an interesting quarter in that performance was a reversal of 2016 and particularly the fourth quarter of last year. As you can see from the table below, larger stocks outperformed smaller stocks. As measured by the S&P 500 Index, large stocks gained more than 6 percent while micro-cap stocks barely produced a gain, as the Russell Microcap Index rose by only 0.4 percent. In addition, growth stocks outperformed value stocks in the first quarter, which is also the opposite of what happened last year.
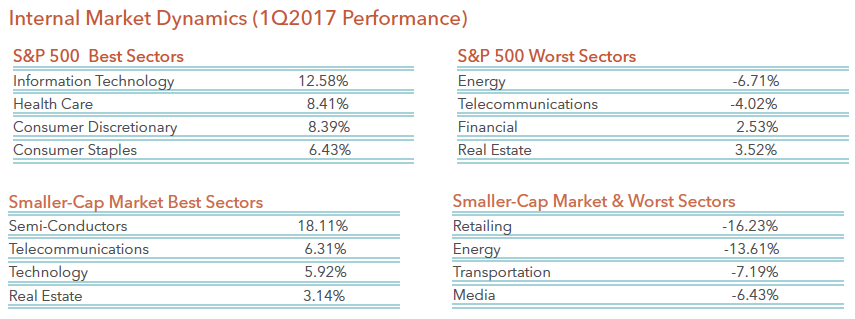
While not a surprise, the internals of the markets show us exactly why growth stocks outperformed value stocks. Below is a table of the best and worst performance for each sector within the S&P 500 Index, as well as the best and worst performance for each sector within the smaller-cap market. Technology and health care sectors were best performers in the first quarter. Technology and health care sectors are typically found within growth-oriented indexes, while energy and financials can be found in value-oriented indexes.
A closer look within each of these sectors reveals that high return on invested capital (ROIC) companies performed worse than the rest of the market in the first quarter. For example, the top 25% of ROIC companies’ stocks declined 1.91% versus a 2.86% gain for the bottom 25% of ROIC companies. We view this recent underperformance as a short-term reversal from the past year, but not a change in trend. In other words, high quality companies have been the leaders in the past year, and we expect them to resume their leadership later this year. Let’s review a few of the reasons we remain optimistic.
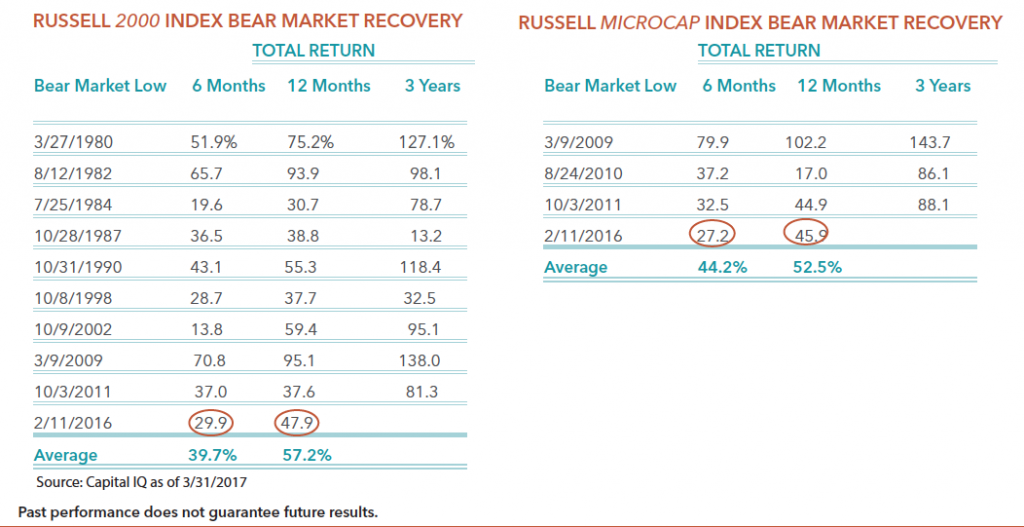
First, we believe we are still early in the bear market recovery or new bull market for smaller-cap stocks. As we noted in our commentary a year ago, the bear market for smaller companies ended on February 11, 2016. Since that date, smaller companies have performed well, but certainly not in a straight line. We also noted in our commentary that bull markets usually don’t end within a year. Bull markets tend to last at least a few years. We updated our tables of bear market recoveries below. As you can see from the two tables below, the 6-month and 12-month performance for the current recovery are approximately 10 percentage points behind the average for the Russell 2000 Index, and approximately 12 percentage points behind the average for the Russell Microcap Index. These results give us confidence that the future 3-year performance for the current cycle could be similar to the past averages.
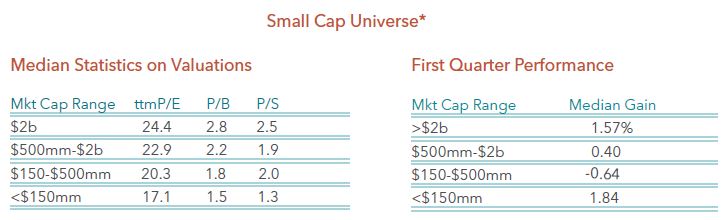
Second, we are forecasting strong earnings growth for smaller companies. While earnings growth in the past year was only slightly positive, we have indications that earnings growth should improve in the future. According to our internal research, we believe earnings growth should be in the double-digit range this year, as well as next year. While valuations are not cheap, strong earnings growth should justify current stock prices as well as higher prices in the future.
Lastly, the Trump Administration has several initiatives that are pro-business. Some of those initiatives include tax reform, regulation reform, and various infrastructure improvements. While it is unlikely that most of these initiatives will make it past congress, some will, which will be positive for equity markets.