Manager Commentary-Archive
Manager Commentary, 1st Quarter 2016
BEAR MARKET and BEAR MARKET RECOVERY
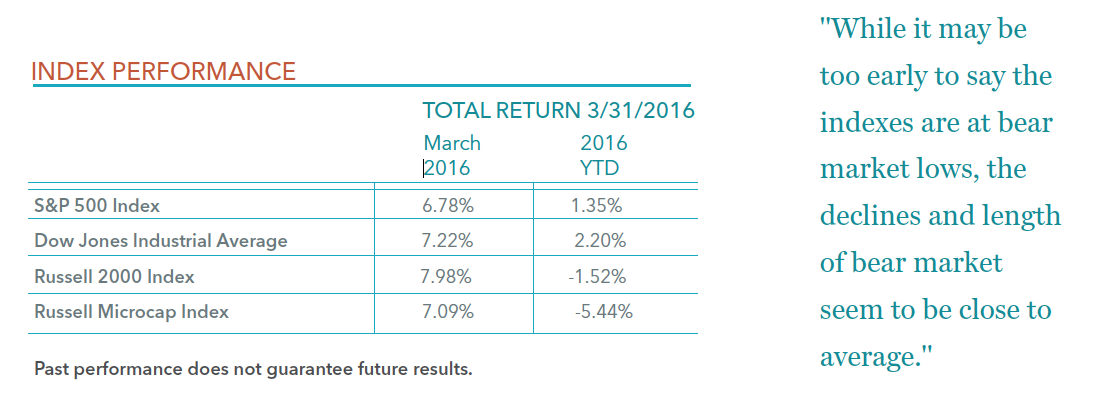
The first quarter of 2016 proved to be very volatile for the equity markets. While there are several factors that contributed to the volatility, the Federal Open Market Committee (FOMC) shifting from hawkish to dovish policy is certainly a big one. A hawkish policy favors higher interest rates and tighter monetary controls to keep inflation in check. A dovish policy refers to an economic outlook which generally supports low interest rates as a means of encouraging growth within the economy. It was surmised by many that the FOMC would raise interest rates four times this year, but recent consensus is for perhaps only two hikes in 2016. The small- and micro-cap market started the year off with a 16.04% decline in the Russell 2000 Index and a 17.50% decline in the Russell Microcap Index through February 11, 2016. However, the markets rebounded nicely in the second half of February and March to finish down modestly. As seen in the table below, the Russell 2000 Index lost 1.52% and the Russell Microcap Index lost 5.44% for the first quarter of 2016.
As we have been saying for some time, the small- and micro-cap have been in a stealth bear market. In other words, the average stock has been in a bear market, but the indexes have not experienced a bear market. We can finally say both the Russell 2000 and the Russell Microcap Indexes hit bear market territory in the first quarter of 2016. While it may be too early to say the indexes are at bear market lows, the declines and length of the bear market seem to be close to average.
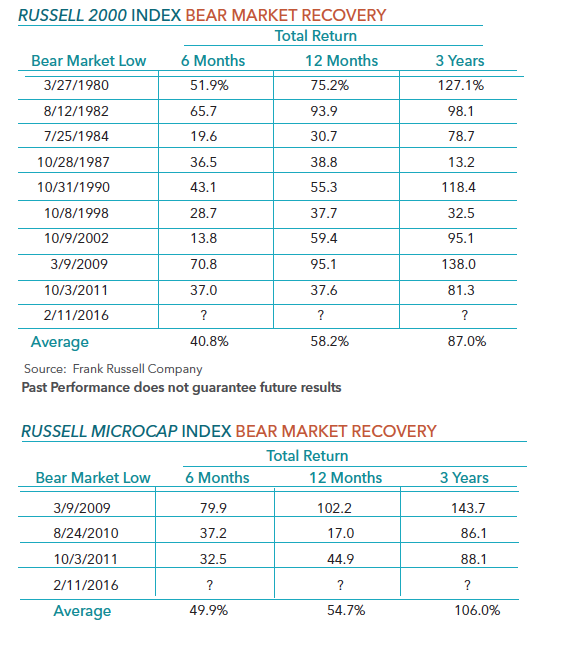
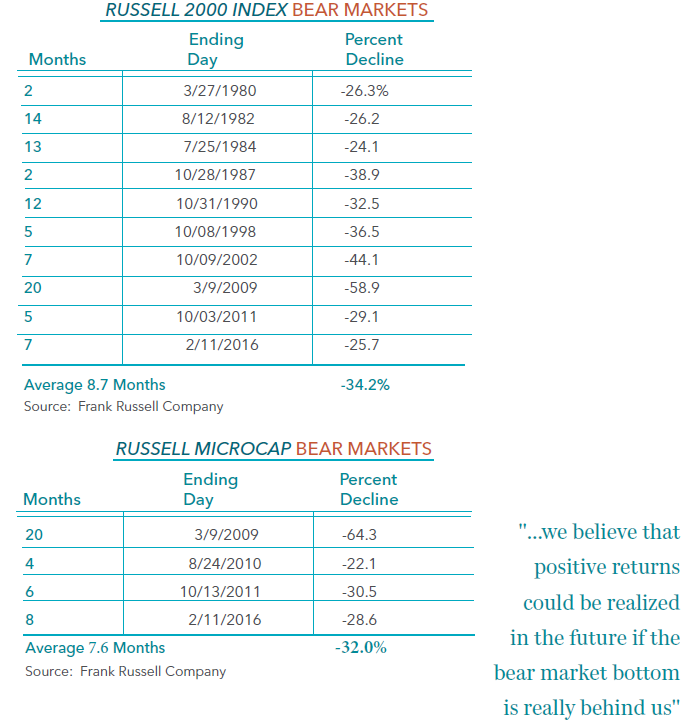
The two tables below give the bear market history for both the Russell 2000 Index and Russell Microcap Index. It should be noted that the Russell 2000 Index started on 12/29/1978 and the Russell Microcap Index started on 6/1/2005. As can be seen below, this is the 10th bear market for the Russell 2000 Index, and the average decline is a little more than 34% with the average length being 8.7 months. This is the 7th bear market for the Russell Microcap Index, and the average decline is 32% with the average length being 7.6 months. The majority of bear markets are usually associated with a recession or a “black swan” event. While it is difficult to rule out a recession or a “black swan” event in the near future, it appears unlikely to us, which gives us confidence that the worst of the decline for small- and micro-cap stocks is behind us.
It may not be a surprise, but historically as the tables below indicate, the best time to put new dollars to work were at bear market lows. The two tables show the Russell 2000 Index and the Russell Microcap Index performance for 6 months, 12 months, and 3 years after the bear market low. As can be seen below, each period results in a positive return. In addition, the average gain for the Russell 2000 Index and the Russell Microcap Index are impressive after the bear market, particularly for the 12 month and the 3 year periods. While it is not clear if the bear market did bottom on February 11, 2016, we believe that positive returns could be realized in the future if the bear market bottom is really behind us.