

Manager Commentary-Archive
Manager Commentary, 1st Quarter 2012
Three Years Later: Investor Sentiment Still Timid
You would not believe that investor confidence has returned if you only paid attention to the headlines. News of troubles in the Eurozone, a potentially slowing Chinese economy and partisan bickering in the U.S. have all contributed to a very pessimistic attitude among equity investors. Yet stock prices tell a much brighter story, as seen in the performance table below. Our MicroCap Funds have returned nearly 30% annually over the last three years since the market lows and overall equity markets, as measured by the S&P 500 Index, have approximately doubled during the same period. What investors fail to realize is that equity markets have typically climbed a “wall of worry” and that in terms of stock prices the headwinds in the news today are largely a thing of the past. We remain confident in the future of small/micro-cap equities based on our conversations with management teams, who are much more optimistic than headlines might have you believe. Companies are reporting strong corporate profits, cash flows are rising, and management teams are strategically deploying cash by increasing dividends, buying back shares, or making accretive acquisitions. In fact, this “cash attitude” thesis we have spoken about previously was confirmed by the world’s largest company, Apple (AAPL), which recently declared a dividend and outlined other plans to deploy cash.
“Companies are reporting strong corporate profits, cash flows are rising, and management teams are strategically deploying cash by increasing dividends, buying back shares, or making accretive acquisitions.”
Click here for standardized fund performance.
Performance data quoted represents past performance; past performance does not guarantee future results. The investment return and principal value of an investment will fluctuate so that an investor’s shares, when redeemed, may be worth more or less than their original cost. Current performance of the fund may be lower or higher than the performance quoted. Performance data current to the most recent month end may be obtained by calling 1-800-331-8936. The funds impose a 2% redemption fee for shares held less than 90 days. Performance data quoted does not reflect the redemption fee. If reflected, total return would be reduced.
According to the Investment Company Institute, investors have placed nearly one trillion dollars (net) into bond funds while taking nearly five hundred billion dollars out of domestic equity funds during the past six years. This massive flow from equity funds into bond funds is not surprising given that investors have experienced volatile equity markets with little return (specifically in large-cap equities) during the past ten years*.
The flows are not only from individual investors but also institutional investors such as pension funds. In fact, according to pension consulting firm Millman, assets into equities dropped to 38% in 2011 from 44% in 2010; while fixed income climbed to nearly 42% from 36% in the same time period. It may get even worse. Neil Schloss, VP and Treasurer of Ford Motors (F) was quoted at a recent conference saying, “we’re about 45% bonds today and over time we will move to a target of about 80% bonds.”
Equity markets have performed well despite a relentless outflow of cash due to several reasons including strong corporate profits, the fact that companies are purchasing back their own shares and the simple law of supply and demand. While the “demand” for equities is declining as seen in the patterns of inflows and outflows, the “supply” has actually decreased at the same time. The number of stocks publicly traded and the amount of shares available to investors has significantly declined over the past ten years. According to The Frank Russell Company, the number of investable stocks has declined by 40% since 1999. In 1999 there were nearly 6,000 domestic companies listed on major exchanges, as compared to just 3,566 today. If investors return to equity markets in any magnitude, a simple law of economics would suggest that the shrinking supply of companies to invest in could have a strong impact on rising prices.
How is your portfolio is positioned today compared to ten years ago?
We build portfolios from the bottom up based on a fundamental analysis of financial statements and in-person meetings with company management teams, so we do not make macro calls. However, a look at how our portfolios are structured does provide an understanding of where we are finding the most attractive valuations.
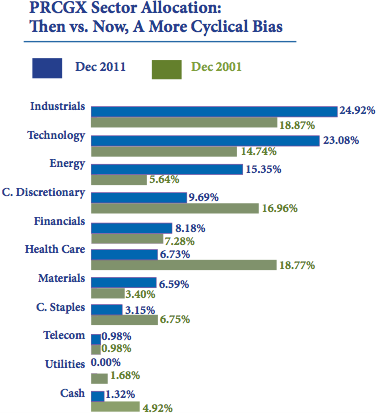
There is a greater allocation to cyclical companies in our portfolios today as compared to ten years ago. As you can see in the accompanying table*, just 10% of our portfolios are invested in defensive sectors such as consumer staples, health care, utilities or cash. Ten years ago this number was over 30%. This demonstrates our outlook that the business cycle is on the mend and that more economically sensitive small companies are beginning to thrive. While our cyclical bias detracted from performance somewhat in 2011, the top three sector contributors to performance in 2012 are technology, energy and industrials.
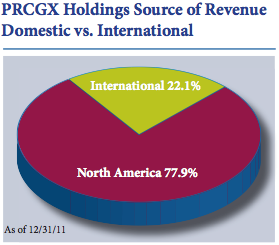
Sales of U.S. small/microcap companies are generally less global than that of large companies. According to Standard & Poor’s most recent analysis*, S&P 500 companies posted 46.3% of their sales from outside of the United States in 2010. By contrast, over three-quarters of revenues for companies in the Perritt MicroCap opportunities Fund were from North America. While some international economies appear to be faltering – notably the Eurozone where unemployment hit a 15 year high in February – there has been visible strength in the U.S. economy according to major indicators. The February University of Michigan consumer confidence and Institute of Supply Management service index reached their highest point in one year, the initial jobless claims 4 week average is at its lowest point since March 2008, and vehicle sales recorded the best month since May 2008 (excluding the cash for clunkers month of August 2009). Investors who wish to participate in im- provements in the U.S. economy may wish to look to small/micro-caps with more domestically-driven revenue sources as they seek to take advantage of U.S. improvements.
“Investors who wish to participate in improvements in the U.S. economy may wish to look to small/micro-caps with more domestically-driven revenue sources as they seek to take advantage of U.S. improvements.”
While some international economies appear to be faltering – notably the Eurozone where unemployment hit a 15 year high in February – there has been visible strength in the U.S. economy according to major indicators. The February University of Michigan consumer confidence and Institute of Supply Management service index reached their highest point in one year, the initial jobless claims 4 week average is at its lowest point since March 2008, and vehicle sales recorded the best month since May 2008 (excluding the cash for clunkers month of August 2009). Investors who wish to participate in improvements in the U.S. economy may wish to look to small/micro-caps with more domestically-driven revenue sources as they seek to take advantage of U.S. improvements. First quarter outperformance for the MicroCap Opportunities Fund was largely a result of stock selection and our cyclical bias. The top sector contributors included Technology (added 4.2% to performance), Energy (2.9%) and Industrials (2.9%). Because the microcap space is so vast, the active returns investors can earn are much more likely to come from stock selection as opposed to sector bets. That said, microcap stocks in sectors which the market is favoring can experience the catalyst which transforms them from an unknown to a Wall Street darling in an instant. For example, Global Cash Access (GCA), one of our top performing holdings, increased over 75% for the quarter after finally being recognized by analysts on Wall Street. Recent trading volume in GCA is four or five times greater than when we first began purchasing it. Despite the 75% increase in price, as of 3/31/12 the stock traded at only ten times earnings today, demonstrating how undervalued it was before other investors caught on. As we often like to do once volume picks up and price increases rapidly, we have reduced our risk by taking some profits off the table.
All of the outperformance by the Emerging Opportunities fund during the first quarter was due to stock selection. This is often the case when investing in companies with a median market capitalization of approximately $60 million which are so far off the traditional radar. We had some of our best success investing in technology stocks, which contributed 4.2% to the Fund’s performance as a sector. One of our top performing holdings, Innodata (INOD), is a business specializing in e-reader and e-book technology. The company helped Amazon develop the Kindle and has now been brought on to help Apple develop the e-reading technology in the iPad. INOD has no analyst coverage despite earning over $100 million in revenue and a healthy backlog of clients.