From the desk of...
Consumer Confidence and Microcap Stock Performance
 Michael Corbett
CEO, CIO, Portfolio Manager
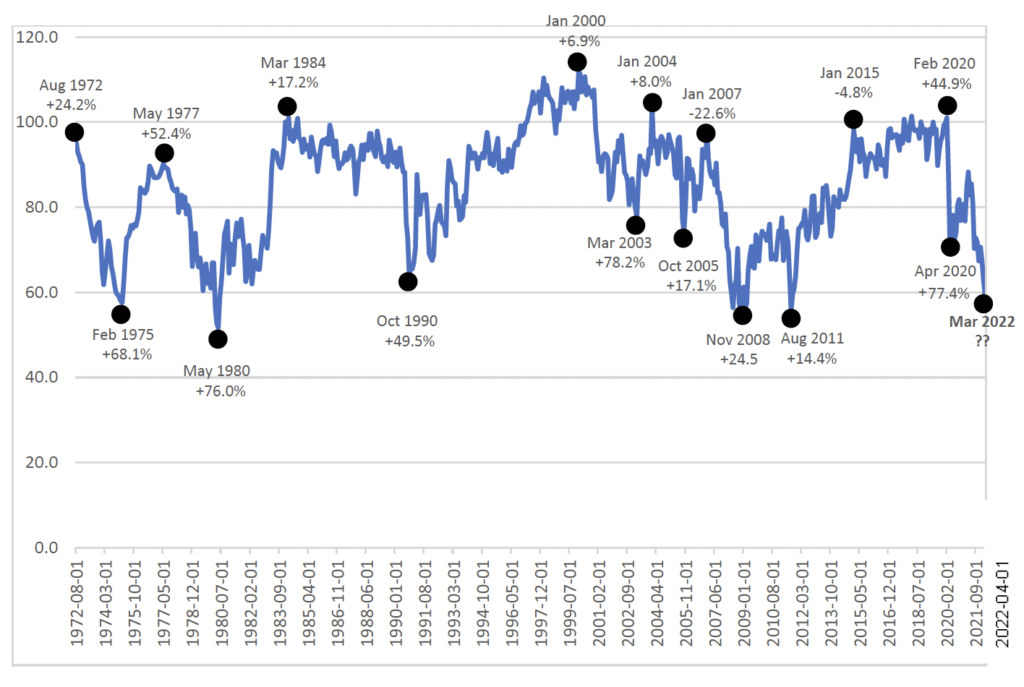
As the old adage says, a picture is worth a thousand words. The chart below shows how strong microcap performance can be in times following extremes in consumer sentiment.
We have plotted the University of Michigan Consumer Sentiment Index readings over the past 50 years. You will see microcap stock returns marked for the 12-month periods following consumer confidence peaks and troughs. While the average consumer confidence reading is 86, the extremes dip to near 50 and rise to more than 110.
Consumers can be a particularly moody bunch, but investors can be moodier. While most of the peak and trough points produced positive results for microcap stocks in the following 12-months, the degree of the returns is far stronger from trough periods. See for yourself.
Consumer Confidence and Microcap Stock Performance