

News
PRCGX Named to Charles Schwab OneSource Select List
The Perritt MicroCap Opportunities Fund (PRCGX) was named to Charles Schwab’s Mutual Fund OneSource Select List® as of June 30, 2017. The Mutual Fund OneSource Select List® is comprised of no-load and no-transaction fee mutual funds that the Charles Schwab investment Advisory, Inc. has screened rigorously for performance, risk, and expenses. The purpose of the Select List is to help investors sort through the thousands of available mutual funds.
To view the Press Release, click here.
PRCGX Named to Charles Schwab's Select List Advisor Edition™
The Perritt MicroCap Opportunities Fund (PRCGX) was named to Charles Schwab’s Mutual Fund Select List Advisor Edition™ as of 3/31/2017. Charles Schwab Investment Advisory, Inc. creates this list after conducting extensive research on the full range of actively managed funds through Schwab’s Mutual Fund platforms. The Select List Advisor Edition™ is built by aiming to identify funds that offer the most favorable combination of factors, such as performance, risk, and expense. The purpose of the Select List is to help advisors sort through the thousands of available mutual funds.
To view the Press Release, click here.
MicroCap Review: Perritt Capital Management - History of Small Company Stocks
Ever since financial markets materialized, investors have been devising schemes to enable them to beat the market’s average return. Some invest in large companies, some invest in small companies, and others ignore company size and invest in companies of any size so long as they have potential to produce excess returns.
Click here to read the full article.
11 Tax-Loss Stocks to Pick Up Before the End of the Year
Every year around this time, retail investors “return” their broken stocks for some of the money they put into them, in a maneuver known as tax-loss selling that lets them deduct realized stock losses against market gains.
Click here to read the full article.
Distribution Update
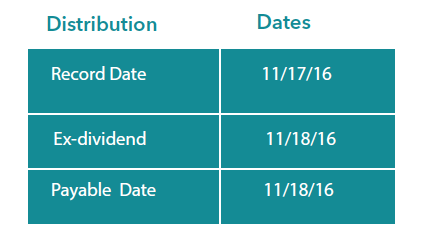
The Perritt MicroCap Opportunities Fund and the Perritt Ultra MicroCap Fund paid distributions on 11/18/16 to shareholders of record on 11/17/16.
- The Long-Term Capital Gain distribution in the Perritt MicroCap Opportunities Fund (PRCGX) was $3.26969 per share and $0.71032 per share in the Perritt Ultra MicroCap Fund (PREOX).
- The Short-term Capital Gain distribution in the Perritt MicroCap Opportunities Fund (PRCGX) was $0.02051 per share and $0.02136 per share in the Perritt Ultra MicroCap Fund (PREOX)
- The Perritt Low Priced Stock Fund (PLOWX) paid no distributions.
- The Long-Term Capital Gain distribution in the Perritt MicroCap Opportunities Fund (PRCGX) was $3.26969 per share and $0.71032 per share in the Perritt Ultra MicroCap Fund (PREOX).
- The Short-Term Capital Gain distribution in the Perritt MicroCap Opportunities Fund (PRCGX) was $0.02051 per share and $0.02136 per share in the Perritt Ultra MicroCap Fund (PREOX).
- The Perritt Low Priced Stock Fund (PLOWX) paid no distributions.
Portfolio Manager Michael Corbett’s most recent commentary, including: "You Can't Always Get What You Want" Performance and Valuation Update
“YOU CAN’T ALWAYS GET WHAT YOU WANT”
Low cost passively managed funds have been all the rage for investors in the past few years. According to Morningstar, investors have pumped $437 billion into passively managed funds in the past twelve months while yanking $303 billion from actively managed funds. Given recent rule changes, this interest in passive funds could grow further. The Department of Labor (DOL) earlier this year introduced a new Fiduciary rule, set to take effect in April 2017, which holds individual advisors who work with tax-advantaged retirement accounts to a fiduciary standard, meaning they must work in the best interest of clients. At the top of advisor’s and investor’s minds is cost, which can lead them to passively managed funds. Morningstar also recently said the new Fiduciary Rule by the DOL could attract as much as another $1 trillion into passive funds.
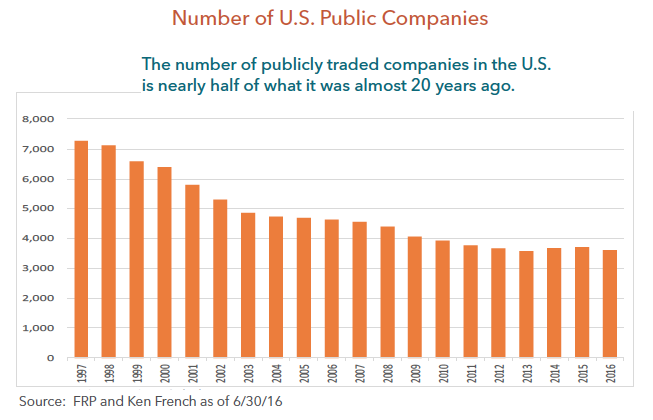
Before you go out and join the others in buying passive funds, we believe it is important to understand history and the details of the indexes used to create these passive funds. The number of publicly traded companies in these indexes has declined dramatically in the past 20 years, which we believe has huge implications for passive investors. As you can see from the chart above, the number of U.S. companies listed on the major exchanges has declined from more than 7,000 to less than 3,600 today. We think it is quite ironic that the Wilshire 5000 Index only has 3,600 U.S. companies in the index.
There are several reasons for the decline in public companies, but many are related to the lack of IPOs and the regular occurrence of mergers and acquisitions. We would argue that quality companies are routinely acquired, therefore there are less public companies which reduces the quality of the indexes. In fact, one of the most important factors we use to judge company quality is profitability.
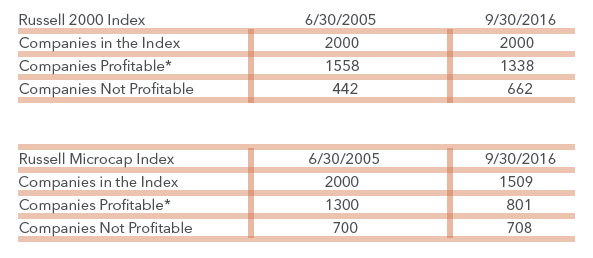
The table below details some interesting history for the Russell 2000 Index and the Russell Microcap Index. As you can see, the number of profitable companies has declined significantly in the past 10 years while the number of unprofitable companies has increased significantly. In fact, the Russell Microcap Index has lost nearly 500 profitable companies during the past 10 years, and the percent of profitable companies in the Index is only a little more than 50%. In addition, nearly 150 of those 500 companies were only recently removed from the Index, and the majority of those were related to buyouts. It is important to note that this is a record high of unprofitable companies for the Russell Microcap Index and a non-recessionary high for the Russell 2000 Index. We believe these statistics increase the attractiveness of active management within the small/micro-cap marketplace.
As I mentioned earlier, investors are flocking to passively managed funds, which include products that mirror the Russell 2000 Index and the Russell Microcap Index. In the past 10 years or so, we have seen assets invested in these vehicles grow from less than $1 billion to tens of billions. For example, iShare offers IWM, which is an ETF tracking the Russell 2000 Index. This passive fund has grown from less than $1 billion in assets a little more than 10 years ago to nearly $30 billion today, and this is only one of several passive funds in the small-cap space.
The bottom line is that we believe investors want a low cost diversified portfolio of high quality stocks, but you can’t always get what you want. We believe if investors are willing to pay a little more for the skill of an active manager, they can get what they need.
PERFORMANCE AND VALUATION UPDATE
Performance data quoted represents past performance; past performance does not guarantee future results. The investment return and principal value of an investment will fluctuate so that an investor’s shares, when redeemed, may be worth more or less than their original cost. Current performance of the fund may be lower or higher than the performance quoted. Performance data current to the most recent month end may be obtained by calling 800-331-8936. The funds impose a 2% exchange and redemption fee for shares held 90 days or less. Performance data quoted does not reflect the redemption or exchange fee. If reflected, total return would be reduced.
Performance data quoted of the Low Priced Stock Fund for periods on or prior to 2/28/14 represents past performance of the fund’s predecessor, a separately managed account. The fund is the successor to a separately managed account. The investment policies, objectives, guidelines and restrictions of the fund are in all material respects equivalent to those of the predecessor, and the predecessor’s portfolio managers are the current portfolio managers of the fund. However, the predecessor was not a registered investment company. Had the predecessor been registered under the Investment Company Act and been subject to the provisions of the Investment Company Act and the Internal Revenue Code to which the fund is subject, its investment performance may have been adversely affected. The performance information reflects the gross expenses of the predecessor adjusted to reflect the higher fees and expenses of the fund. The performance is shown net of the annual management fee of 1.00% and other expenses. The performance was achieved by the predecessor when assets were relatively small; the same strategies may not be available, and similar performance may not be achieved, when the fund’s assets are larger.
The MicroCap Opportunities Fund is a successor to the investment performance of the Perritt MicroCap Opportunities Fund, the Fund’s predecessor. Performance information shown for periods on or prior to March 31, 2014 is that of the fund’s predecessor. The MicroCap Opportunities Fund was advised by the same adviser, has the same investment objective and strategies as the predecessor fund.
1The investment adviser has voluntarily agreed to waive fees and/or reimburse operating expenses (other than interest, brokerage commissions, dividend expense on short sales, taxes, extraordinary expenses and acquired fund fees and expenses) through 2/28/2017.
DISTRIBUTION UPDATE
The Perritt MicroCap Opportunities Fund and the Perritt Ultra MicroCap Fund paid distributions on 11/18/2016 to shareholders of record on 11/17/2016.
The Forbes / RIA Channel Video
Julie Cooling from RIA Channel, contributor to Forbes, interviews Michael Corbett, CEO, CIO and Portfolio Manager of Perritt Capital Management. Cooling and Corbett discuss Perritt’s focus on the small-cap and micro-cap space. Corbett explains that small-caps and micro-caps have been in a bear market for the past two and a half years and he believes there is a compelling investment case for active small-caps.
This Ecommerce Auto Parts Stock Is Undervalued
U.S. light-vehicle automotive sales reached a record 17.4 million in 2015 and are forecast to rise 2.3% in 2016. Despite automotive sales at record highs, the stock performance of manufacturers such as Ford (F) and General Motors (GM) has not been great. The major reason for lackluster performance is inconsistent profit performance.
Click here to read the full article.
Portfolio Manager Michael Corbett’s most recent commentary, including: A New Bull Market for Small Stocks Very Compelling Valuations
THE START OF A NEW MICRO-CAP BULL MARKET?
The extreme market swings within the small/micro-cap universe in the second quarter of 2016 sent investors a clear message. Volatility is here to stay in our opinion, but a new bull market for small stocks started earlier this year. As we discussed in our last quarterly commentary, small/micro-cap universe hit a bear market low on February 11, and stock prices rose dramatically in March and April. However, the poor May jobs report and the surprise Brexit news sent stocks lower quickly. To us, the real surprise was the resilience the market showed post-Brexit. Just days after the Brexit vote, small/micro-cap equities resumed their strength. When markets face big negative news as well as get hit by a big surprise, such as the Brexit news, and equities still trade higher, that is significant! The second quarter performance results are listed below, but what is not reported is the bull market performance. As of June 30, the Russell 2000 Index is up 20.78% from the February 11 low, which is a bull market to us, but the Russell Microcap Index was up 19.16% for that same period, just short of a 20% bull return. It only took one more day in the third quarter for the Russell Microcap Index to hit the official bull market definition of up more than 20%.
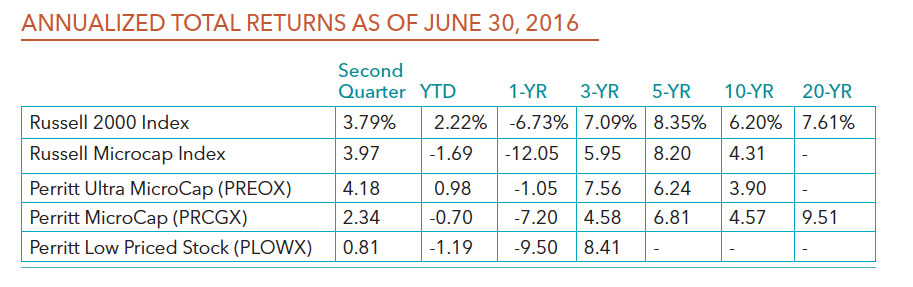
Performance data quoted represents past performance; past performance does not guarantee future results. The investment return and principal value of an investment will fluctuate so that an investor’s shares, when redeemed, may be worth more or less than their original cost. Current performance of the fund may be lower or higher than the performance quoted. Click here for standardized performance. Performance data current to the most recent month end may be obtained by calling 800-331-8936. The funds impose a 2% exchange and redemption fee for shares held 90 days or less. Performance data quoted does not reflect the redemption or exchange fee. If reflected, total return would be reduced.
“We believe this is a bull market for small/micro-cap equities, and we are confident the markets will recognize the high quality companies within each of our portfolios.”
In our opinion, the obvious question now is how long and how far will the bull market take us. Unfortunately, my crystal ball does not lend itself well to those types of predictions, but I thought it would be useful to examine some of the quality investments we have made within our Funds.
Let’s start with how our Fund’s portfolios are different from the broader markets, such as the Russell 2000 Index and the Russell Microcap Index. Each of the Russell Indexes have investments of more than 25% in financial services. While our funds have a decent weight in financial services,** each of the indexes have significant exposure to banks. Our financial services weights include more niche insurance companies and asset managers. We believe our financial companies are more attractive investments. For example, one of our largest holdings that we own in all three Funds is Atlas Financial (AFH). Atlas is the largest independent provider of insurance for transportation companies, primarily taxi-cabs. The company has grown its business well in excess of 20% in the past three years, but yet trades only at 11.6x 2016 earnings.
Healthcare is another large weight within the Russell Indexes. The Russell Microcap Index has approximately 20% invested in healthcare companies. Nearly half of those healthcare companies are biotechnology companies. These biotechnology companies and many of the other healthcare companies don’t meet our strict quality measurements. As a result, our healthcare weights are well below than that of the Russell Indexes. To us, the opportunities lie in companies that have strong recurring business models and above average earnings power. We see a great deal of value in industrial and technology companies today. Each of our Funds have greater weights in these two industries than the two Russell Indexes. Some of these industrial companies are construction related, such as NCI Building (NSC) and USG Corporation (USG).
Within our Ultra MicroCap Fund, we feel there are numerous pockets of value. For example, U.S. Auto Part (PRTS) is a truly misunderstood story in our opinion. PRTS is a leader in the pure-play internet aftermarket auto part space. Investors are not giving management any credit for this pure-play and margins that are just starting to show drastic improvement. PRTS gross margins could improve from the low 20% to 30% level within the next few years. In addition, the company’s equity trades at less than half of revenue. Another example is MCFT Holdings (MCFT). MCFT designs, manufactures, and markets recreational sport boats primarily under the MasterCraft brand. Our analysis and due diligence shows that there is a great deal of pent-up demand in MCFT’s business. These are just a couple examples of some potential quality investments within the Ultra MicroCap Fund.
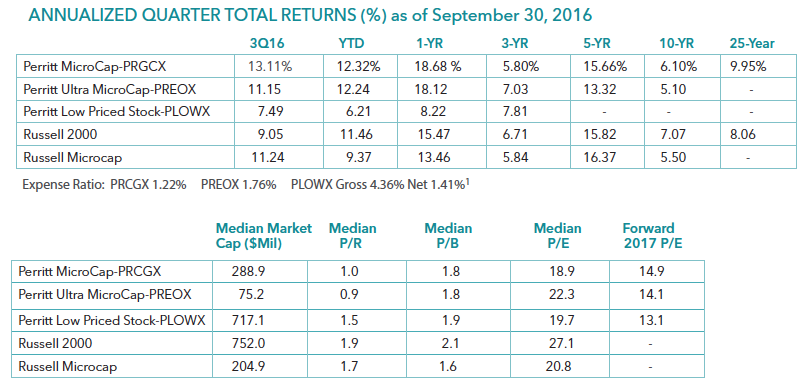
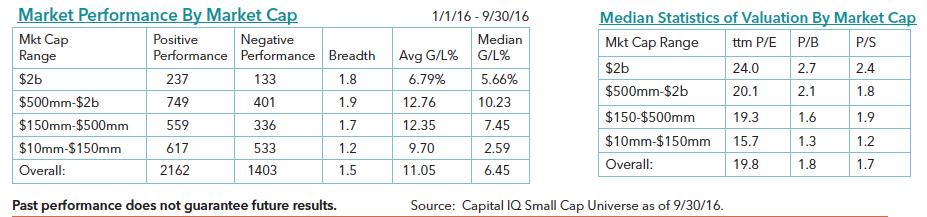
Overall valuations are very compelling in our Funds, too. The majority of the companies in the Low Priced Stock Fund are valued at a lower multiple of revenue, book value, and earnings versus that of the Russell 2000 Index.1 Our MicroCap Opportunities Fund and Ultra MicroCap Fund also have lower valuations relative the Russell Microcap Index.1 We often tell our investors that the MicroCap Opportunities Fund may offer higher quality and better valuations relative to that of the Russell Microcap Index. As an example of high quality, the average company in this fund has a return on invested capital of 12% versus only a slight positive for the average company within the Russell Microcap Index.2 Despite those attractive returns, companies in the MicroCap Opportunities trade at less than one times revenue versus 1.4 times revenue for the Russell Microcap Index. As said earlier, we believe this is a bull market for small/micro-cap equities, and we are confident the markets will recognize the high quality companies within each of our portfolios.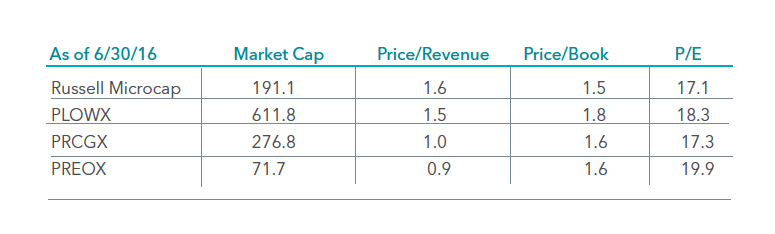
In addition to our opportunistic view of small-cap equities, please click here to receive a third party report that outlines the argument for small-caps.
Plenty of Value Left in Micro-Cap Stocks
In this interview with Raymond James’ Chief Investment Strategist, Jeffrey Saut, Portfolio Manager Michael Corbett discusses the value of micro-cap stocks.
Click below to read article.
Micro-Cap Stocks Are Less Widely Followed, Offer Benefits
In this interview with Charles Rotblut at AAII, Portfolio Manager Michael Corbett discusses how micro-cap stocks may require investors to do more of their own research, in return for the potential of reduced portfolio volatility.
Click here to read the full article.
Planet Microcap Podcast with Portfolio Manager, Michael Corbett
In this interview, the goal is to learn about what a fund is, in particular, a Micro-cap fund, and if there is a difference in philosophy for investing between an institutional and an individual investor, understanding Mike’s due diligence process and his advice for investors looking into investing in Micro-cap stocks.
Click below to listen to the interview with Michael Corbett.
PRCGX Named to Charles Schwab OneSource Select List
The Perritt MicroCap Opportunities Fund (PRCGX) was named to Charles Schwab’s Mutual Fund OneSource Select List® as of 3/31/2016. The Mutual Fund OneSource Select List® is comprised of no-load and no-transaction fee mutual funds that the Charles Schwab Investment Advisory, Inc. has screened rigorously for performance, risk, and expenses. The purpose of the Select List is to help investors sort through the thousands of available mutual funds.
To view the Press Release, click here.
Portfolio Manager Michael Corbett’s most recent commentary, including: Bear Market and Bear Market Recovery Positive Returns after Bear Markets
BEAR MARKET and BEAR MARKET RECOVERY
The first quarter of 2016 proved to be very volatile for the equity markets. While there are several factors that contributed to the volatility, the Federal Open Market Committee (FOMC) shifting from hawkish to dovish policy is certainly a big one. A hawkish policy favors higher interest rates and tighter monetary controls to keep inflation in check. A dovish policy refers to an economic outlook which generally supports low interest rates as a means of encouraging growth within the economy. It was surmised by many that the FOMC would raise interest rates four times this year, but recent consensus is for perhaps only two hikes in 2016. The small- and micro-cap market started the year off with a 16.04% decline in the Russell 2000 Index and a 17.50% decline in the Russell Microcap Index through February 11, 2016. However, the markets rebounded nicely in the second half of February and March to finish down modestly. As seen in the table below, the Russell 2000 Index lost 1.52% and the Russell Microcap Index lost 5.44% for the first quarter of 2016.
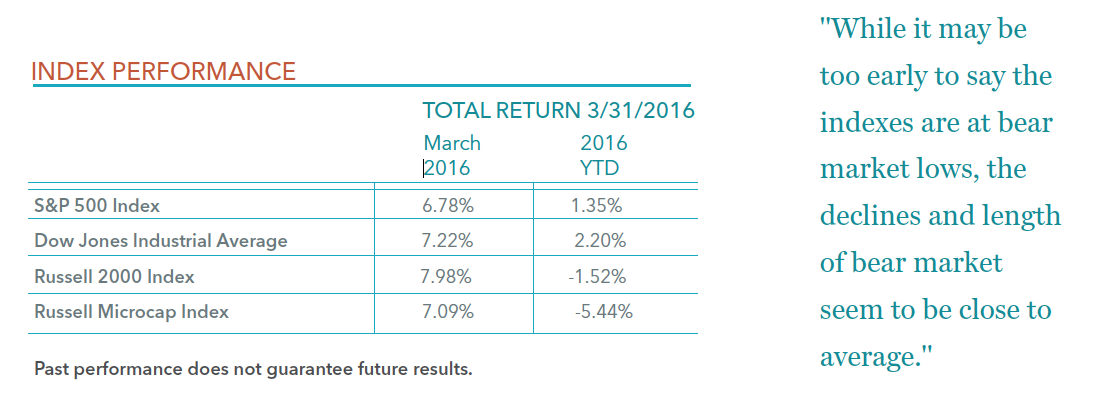
As we have been saying for some time, the small- and micro-cap have been in a stealth bear market. In other words, the average stock has been in a bear market, but the indexes have not experienced a bear market. We can finally say both the Russell 2000 and the Russell Microcap Indexes hit bear market territory in the first quarter of 2016. While it may be too early to say the indexes are at bear market lows, the declines and length of the bear market seem to be close to average.
The two tables below give the bear market history for both the Russell 2000 Index and Russell Microcap Index. It should be noted that the Russell 2000 Index started on 12/29/1978 and the Russell Microcap Index started on 6/1/2005. As can be seen below, this is the 10th bear market for the Russell 2000 Index, and the average decline is a little more than 34% with the average length being 8.7 months. This is the 7th bear market for the Russell Microcap Index, and the average decline is 32% with the average length being 7.6 months. The majority of bear markets are usually associated with a recession or a “black swan” event. While it is difficult to rule out a recession or a “black swan” event in the near future, it appears unlikely to us, which gives us confidence that the worst of the decline for small- and micro-cap stocks is behind us.
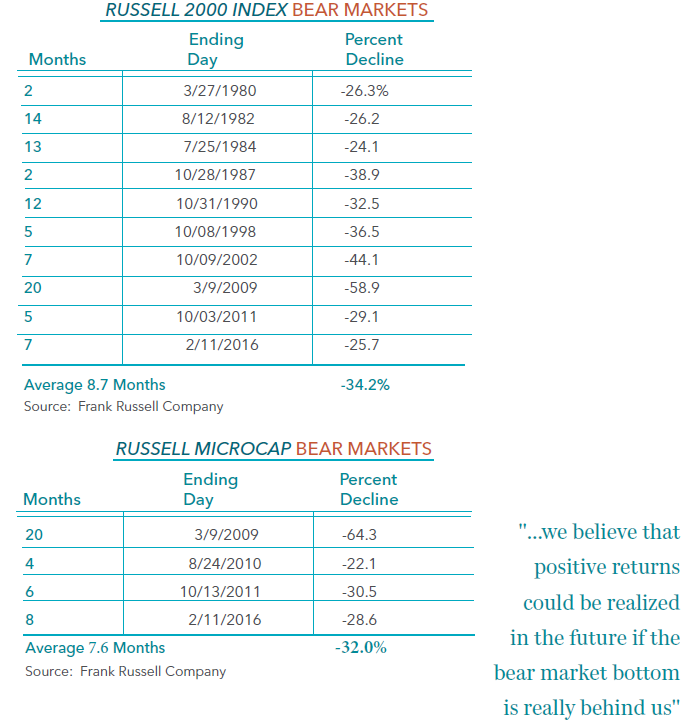
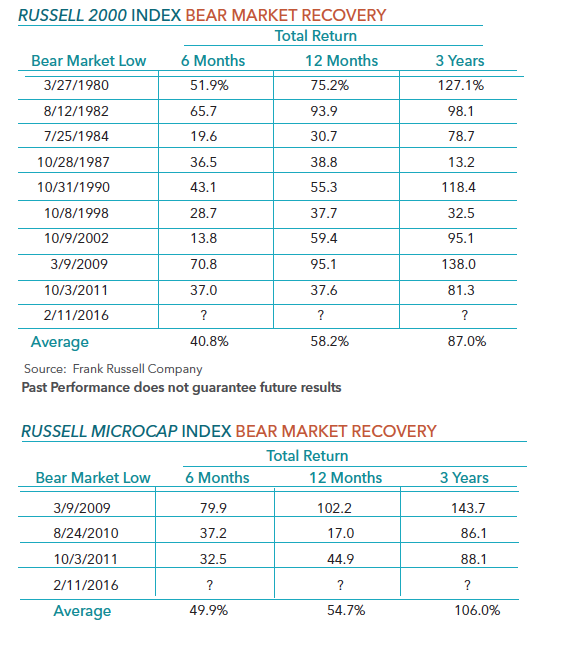
It may not be a surprise, but historically as the tables below indicate, the best time to put new dollars to work were at bear market lows. The two tables show the Russell 2000 Index and the Russell Microcap Index performance for 6 months, 12 months, and 3 years after the bear market low. As can be seen below, each period results in a positive return. In addition, the average gain for the Russell 2000 Index and the Russell Microcap Index are impressive after the bear market, particularly for the 12 month and the 3 year periods. While it is not clear if the bear market did bottom on February 11, 2016, we believe that positive returns could be realized in the future if the bear market bottom is really behind us.
Why the CEO is Buying
Nearly two years ago the U.S. returned as a petroleum powerhouse, a role not seen since the 1970s. The U.S. was pumping so much oil that it became less dependent on foreign supplies and was projected to be the leading world producer in a decade. The reason: Technology made affordable by higher prices.
Click here to read the full article.
They're Giant Today Only in Aspiration
Metro Chicago teems with micro-caps that long for the good old days
While some investors like micro-caps, companies typically don’t relish the status. That’s because many of them have storied pasts and once were bigger. Portfolio Manager Michael Corbett says “We buy into many of these micro-caps because we don’t see much downside from these levels.”
Click here to read the full article.
PRCGX Named to Charles Schwab OneSource Select List
The Perritt MicroCap Opportunities Fund (PRCGX) was named to Charles Schwab’s Mutual Fund OneSource Select List® as of 12/31/2015. The Mutual Fund OneSource Select List® is comprised of no-load and no-transaction fee mutual funds that the Charles Schwab Investment Advisory, Inc. has screened rigorously for performance, risk, and expenses. The purpose of the Select List is to help investors sort through the thousands of available mutual funds.
To view the Press Release, click here.
Wall Street Journal Category Kings
The Perritt Ultra MicroCap Fund (PREOX) was named a Category King by The Wall Street Journal for 12/31/2015 amongst Small Cap Value Funds based on Lipper data. The Category King award recognizes the top 10 funds of each category for one year total returns. You can see more by clicking here.
Please click here for standardized performance.
Performance data quoted represents past performance; past performance does not guarantee future results. The investment return and principal value of an investment will fluctuate so that an investor’s shares, when redeemed, may be worth more or less than their original cost. Current performance of the fund may be lower or higher than the performance quoted. Performance data current to the most recent month end may be obtained by calling 800-331-8936.
The Fund was ranked 288 out of 292 Small Cap Value Funds by Lipper for the one-year period, 121 out of 225 for the five-year period, and 51 out of 159 for the ten-year period ending 9/30/2018. The Wall Street Journal (WSJ) ranking is based on Lipper data. However, the WSJ only considers the largest class of a Fund in their “pool” of Funds for any particular category, whereas Lipper counts every class of a Fund as a separate ranking entity. Because the number of Funds in the WSJ ranking category may be smaller than the Lipper category, the WSJ ranking for the Fund may be higher than the Lipper ranking. References to other mutual funds should not be viewed as an offer of these securities.
Lipper Analytical Services, Inc. is an independent mutual fund research and rating service. Each Lipper average represents a universe of Funds with similar investment objectives. Rankings for the periods shown are based on Fund total returns with dividends and distributions reinvested and do not reflect sales charges.
Outside the Biotech Bubble
Healthcare stocks, particularly biotechnology stocks, have been one of the strongest sectors during the past five years. In fact, the biotechnology weight within the Russell Microcap Index has nearly doubled. Before you get too excited about the space, consider the valuations of biotech stocks.
Click here to read the full article