Manager Commentary-Archive
Manager Commentary, 4th Quarter 2019
PARTY LIKE IT’S 1999
The longest bull market in history keeps rolling along. And the recipients of this bull market’s run are losing money hand over fist. There are more than 40% of listed companies in the U.S. that lose money – the highest level since the late 1990’s outside of post-recession periods. 42% of those money losing companies are health care and 17% are technology companies. Approximately less than a quarter of the companies that went public in 2019 will have positive net income – the lowest level since the tech bubble. Like the tech bubble in 1999, investors are pouring money into tech and now health care. Last year investors put $11 billion into digital health companies. Venture capital funding has reached the dot-com era level. According to research firm Preqin, private equity firms have amassed approximately $1.5 trillion in unspent capital, the highest total on record.
This isn’t the only characteristic that is like the tech bubble. The Fed’s open checkbook is making many observers worried. There is extraordinary liquidity being provided by the world’s central banks, which is flowing to the most liquid and largest names in the S&P 500. This reminds us of 1999, when the Fed expanded the balance sheet at the end of the year and early in 2000 as a precaution against a Y2K disruption. The Fed supplied about $120 billion to the market through repos to prevent a disruption then. This was about the same amount pumped in during the financial crisis of 2008 and more than it provided in reaction to the September 11 attacks. Since October of last year, the Fed has supplied approximately $400 billion in four months – a $1.2 trillion annual rate!!
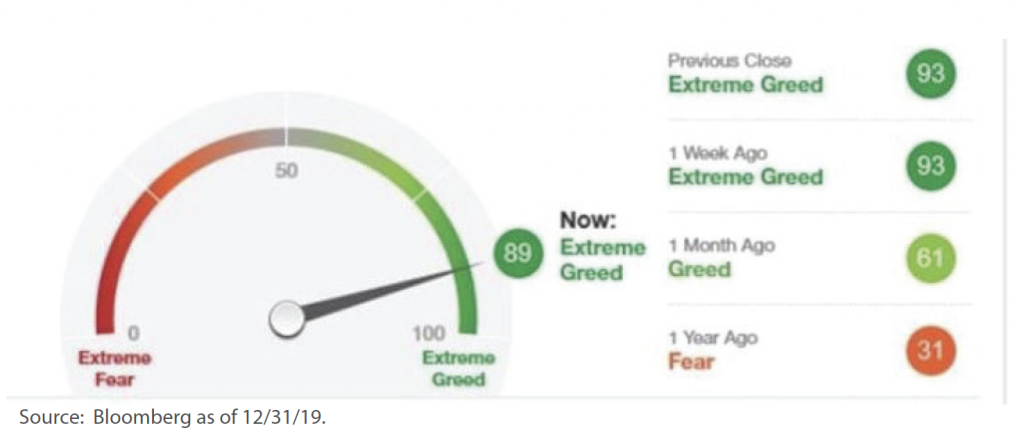
This liquidity is feeding into large, liquid names – the bigger the better. As seen by the Fear & Greed Index below, the greed reading is at 89 down from 93 a week ago. We believe this is FOMO (Fear Of Missing Out) at its best.
FEAR AND GREED INDEX
What emotion is driving the market now?
Here is another data point to think about. There are currently 82% of companies in the S&P 500 Index trading above their 200-day average price, the highest percent in 2 years. A senior trader and market technician at Instinet said the last time so many companies were above this level, a correction followed not long after. According to Chuck Royce, over the last 20 years the 50 biggest stocks in the Russell 3000 Index have averaged a combined total market cap of about four times the total market cap of the Russell 2000. At the end of 2019, that ratio was more than six times – higher than it was at the height of the internet bubble in 2000.
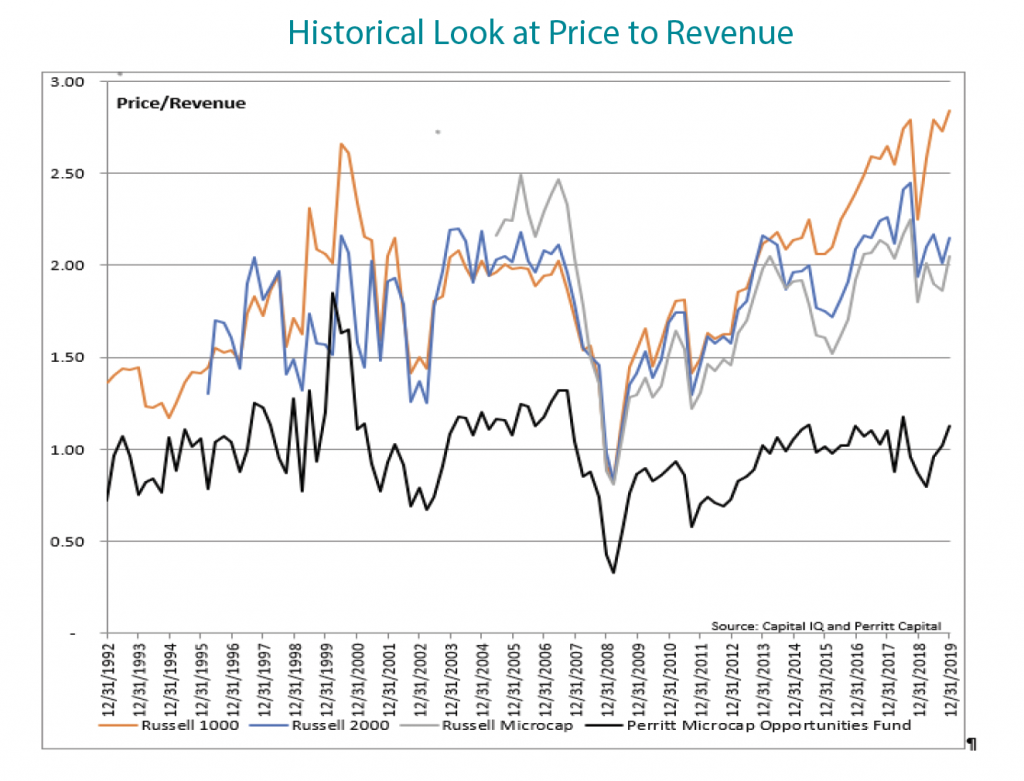
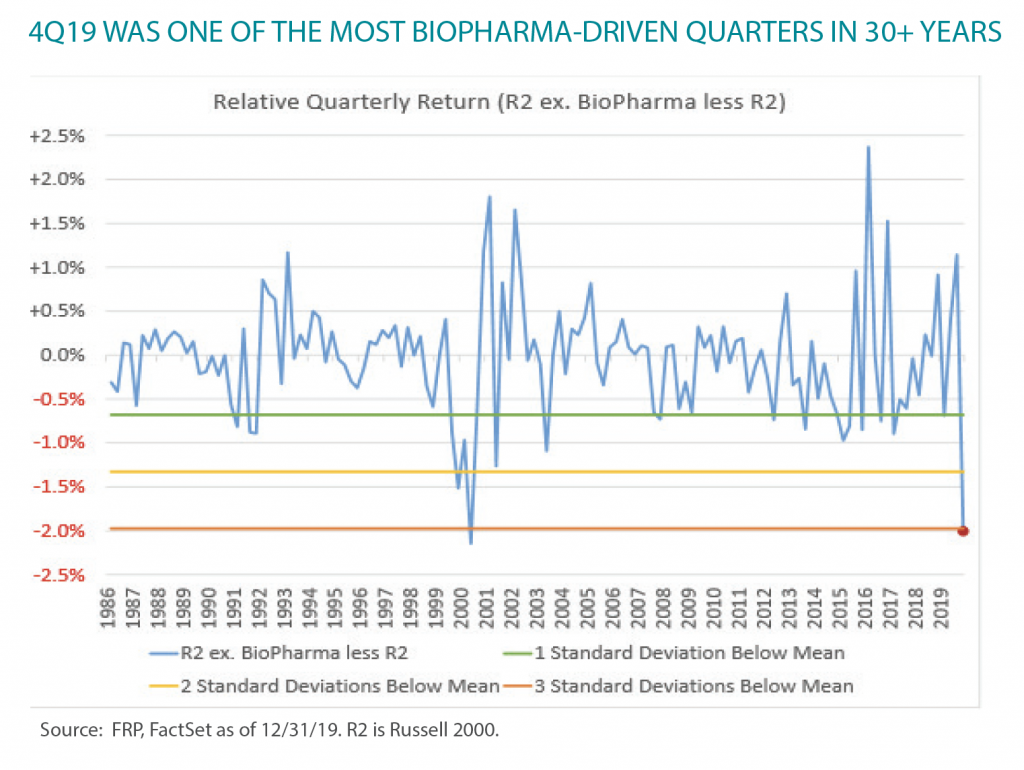
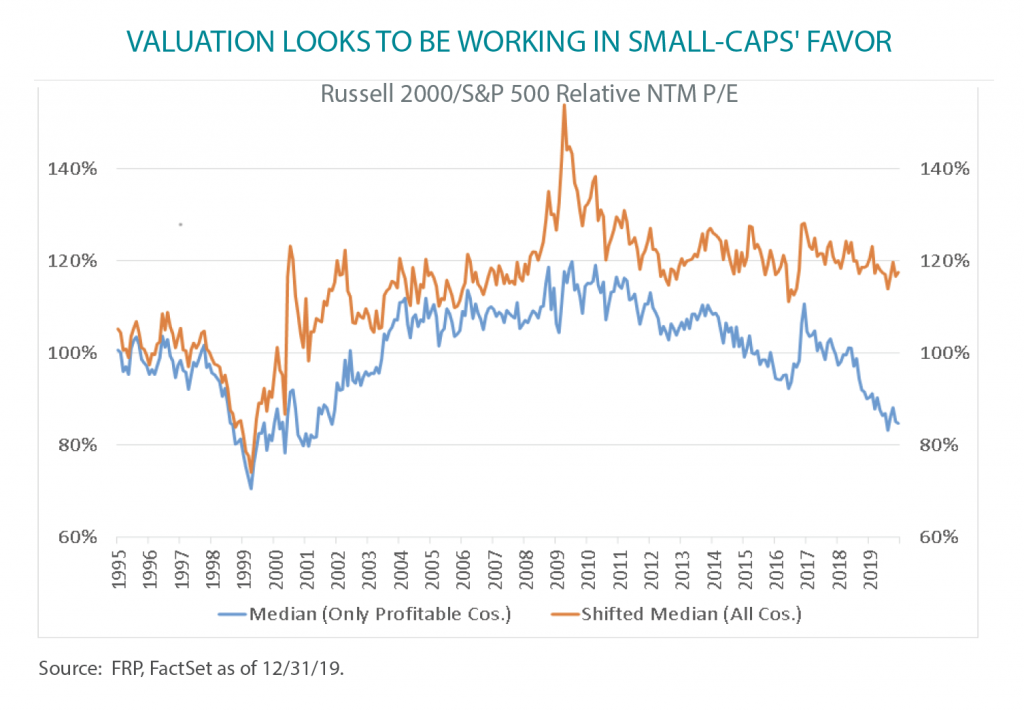
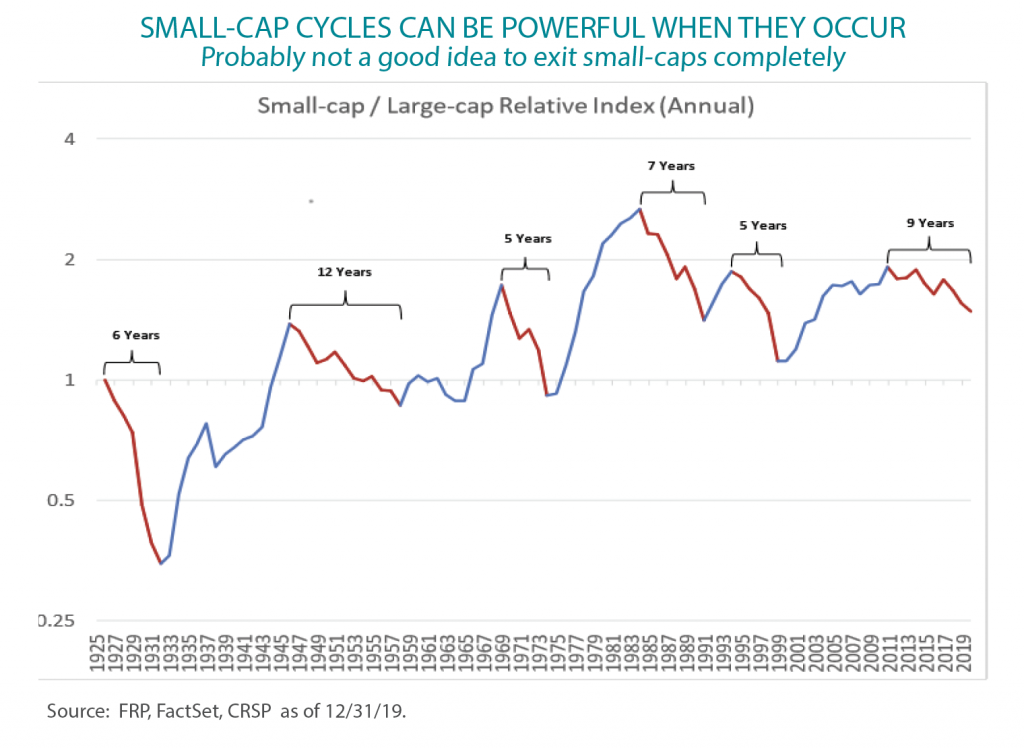
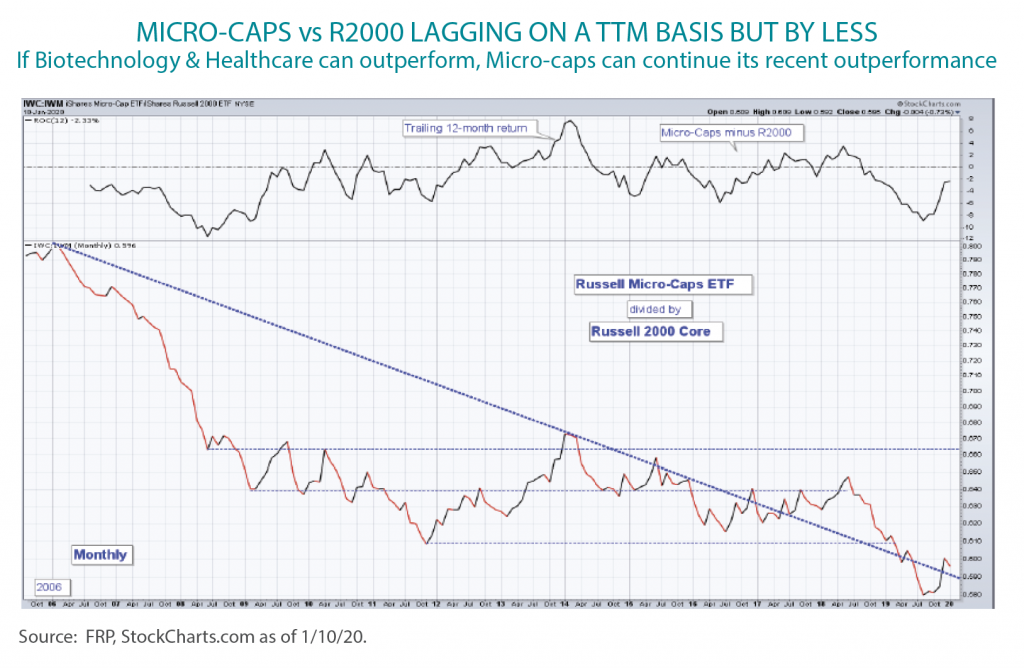
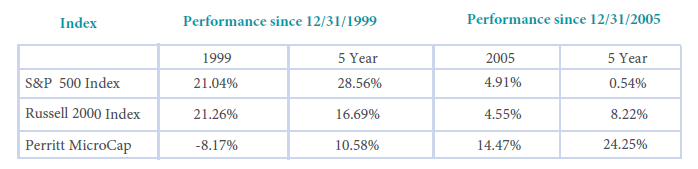
Are we beginning to sound like a broken record? This may not be the makings of a bubble, but it’s the closest thing we have seen to one in a long time. If this is another bubble, the market overall could be in for a rough ride soon. While microcap stocks may get hurt if this bubble pops, we would argue that the damage would be significantly less and the rewards following the carnage could be material. As we have shown in past commentaries, microcap stocks are selling near their largest discount to large-cap stocks in decades. While past performance is no guarantee of future results, this market reminds us a great deal of 1999. The performance table below shows how our MicroCap Opportunities Fund, Russell 2000 Index and S&P 500 performed in the pre and post bubble market of 1999. The results are very striking. Unfortunately, the Russell Microcap Index was not created until 2005, so hence, the reason that Index is not included. The bottom line to us is that small-cap cycles can be very powerful when they occur, and we hope to soon be partying like it’s 1999 again. We provided several other charts from our friends at Furey Research, which give us more confidence in the next positive small-cap cycle.
Click here for standardized performance.
Performance data quoted represents past performance and is no guarantee of future results. Investment return and principal value will fluctuate so that an investor’s shares, when redeemed, may be worth more or less than the original cost. Current performance may be lower or higher than the performance data quoted. Performance data to the most recent month end may be obtained by calling (800) 331-8936. The fund imposes a 2% redemption fee on shares held for less than 90 days. Performance data does not reflect the redemption fee. If reflected, total returns would be reduced. The inception date for the Russell Microcap Index was 6/01/2005, therefore no average annual return figures for the 20-year period are available.