

Manager Commentary-Archive
Manager Commentary, 4th Quarter 2011
Cash Value
What CEO’s of Small Businesses Are Doing Now to Enhance Shareholder Value
Don’t let headline market returns fool you; in the small and micro-cap space, shareholder value is being enhanced. Increased uncertainty and a rush to liquidity led to a disappointing year for micro-cap investors in 2011. However, the noise that is driving investor behavior such as political inaction and partisan bickering is short-term in nature. We are much more interested in analyzing the attitudes of the CEO’s of small businesses that we speak to in our offices every day. These attitudes reflect the true nature of long-term trends in our economy.
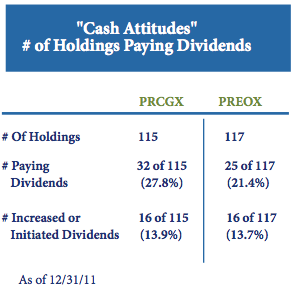
The number one difference that we detect in the management teams between now and 2008-09 is what we describe as their “Cash Attitude.” Simply put, management teams are no longer trying to survive, they are creating new ways to thrive. A few years ago, the top concern for most management teams was ensuring that they had enough cash in the bank to survive a difficult recession. Today, management teams are utilizing their cash and balance sheets to expand their businesses and enhance shareholder value in a variety of ways.
As you know, shareholder value comes in many forms. In addition to bottom-line growth, companies can increase shareholder value by initiating or increasing cash dividends. As can be seen in the accompanying table, nearly one-third of the holdings in the MicroCap Opportunities Fund pay a dividend and nearly 15% increased or initiated a dividend in 2011. Another way companies can enhance shareholder value is by buying back their own company’s stock. Although you’re not as likely to hear about it in the media, small-cap companies are often better positioned than their large-cap peers to buy-back their own shares. There are several companies within our portfolios that continue to buy back their own shares at levels they consider undervalued. For example, AEP Industries (AEPI) repurchased approximately $20 million worth of its shares in a privately negotiated deal in June of last year (nearly 15% of the company’s market cap at that time). We were pleased that management acted on their conviction that the company’s share-price did not accurately reflect shareholder value.
“Simply put, management teams are no longer trying to survive, they are creating new ways to thrive”
Finally, shareholder value can be enhanced by acquiring other companies. With ultra-low interest rates and depressed stock prices, it can make greater economic sense to buy a company rather than build it. Lately, we have seen management teams acquire companies that are not only synergistic but are also imm ediately accretive to their current business. For example, Glo-becomm System (GCOM) acquired Comm Source, Inc. in April 2011. Using cash to buy a profitable company that is delivering current earnings was immediately accretive to Globecomm’s financials.
Valuations
Regarding valuations, the small/microcap universe is attractively priced based on several characteristics, as seen in the accompanying table*. The most talked-about measure, the price-to-earnings ratio, appears the least attractive. However, we en- courage investors to take a closer look at price-to-sales and price-to-book value, which are very compelling. We believe these two characteristics indicate that there is substantial cash flow and/or earnings power that can soon reach the bottom line.

Despite a contraction in valuation multiples, micro-cap equities have been growing cash flows, book values and overall shareholder value over the past few years. Perhaps more importantly, the “cash attitudes” of management teams indicate that there is a robust period of growth underway for well-run micro-cap companies currently being unrecognized by the market. As is often the case, micro-cap stock prices have been slow to respond due in part to their under-followed and under-researched nature. We believe this is a short term phenomenon and that shareholder value will ultimately be recognized with higher stock prices.
In 2011, sector allocation contributed more to The MicroCap Opportunities Fund’s under performance than stock selection. Nearly half of the Fund’s under performance was due to our significant overweight to the Energy and Industrials sectors relative to the benchmark. As we have noted before, much of the under performance in more cyclical sectors was due to a general flight to liquidity as investors abandoned micro-cap stocks during the year. Selling was often focused on the more volatile Energy, Industrials and Technology spaces, and on our lower market caps names in particular.
Regarding stock selection, our largest detractor during the year was within the consumer discretionary segment (Furniture Brands (FBN), Kimball International (KBALB) and CPI Corp (CPY) are examples). We are confident that, over time, investors will realize that these undiscovered companies are in fact trading at very attractive levels relative to their strong underlying fundamentals. Some recovery has already been realized in 2011: although CPY is no longer in the portfolio, FBN and KBALB are up 18% and 23%, respectively, this year (as of 1/25/12). It is important to note that individual stock selection within the energy sector contributed more positive return to the portfolio than did our selection within any other industry. This demonstrates the high level of opportunity that exists in the Energy space, despite the fact that many Energy names struggled to find recognition in 2011. In the micro-cap space, the best Energy opportunities tend to be found in service companies. Two of the portfolio’s top five contributors in 2011 were energy related companies: TGC Industries (TGE) and Newpark Resources (NR).
Under performance in Technology and Consumer Discretionary sectors detracted from The Emerging Opportunities Fund’s relative return in 2011. With a median market capitalization of just $50 Million, the investments in the Perritt Emerging Opportunities’ portfolio tend to be off the radar for traditional Wall Street analysts, helping these companies to move independently of the market. According to Morningstar, the Fund’s r-squared of 66.32 vs. the S&P 500 Index is the lowest of over 8,000 long-only U.S. Mutual Funds, as of 1/25/12.