Manager Commentary-Archive
Manager Commentary, 2nd Quarter 2011
“Risk On, Risk Off”
The Misunderstanding of Business Risk And Why Inefficiency Reigns in the Micro-Cap Space
You don’t need your boutique and “undiscovered” micro-cap manager to tell you this, because you are probably hearing it everywhere. What we can tell you is that in the past six months the stock prices of some of the companies in our portfolio have suffered as a result. We feel these movements are short term in nature and do not greatly interfere with our 3 to 5 year investment outlook.
What we have seen is that investors are currently dismissing a number of micro-cap stocks as “risky” without having a complete understanding of the underlying businesses, and this has led to more pricing inefficiencies in the micro-cap space today.
As our shareholders know, we look for undiscovered companies that are not followed by Wall Street analysts. Stocks get ignored by Wall Street for a long list of reasons that includes a market capitalization that is deemed too small, a stock that is considered a “fallen angel,” or the fact that a company simply has no history or expectation of profitability. One area where we are finding what in our opinion are undiscovered and misunderstood companies today is what we call “cross-over stories.”
A cross-over story is a company that has a cash cow business and is using those profits to feed another business that has accelerating growth rates.
Click here for standardized fund performance.
Performance data quoted represents past performance; past performance does not guarantee future results. The investment return and principal value of an investment will fluctuate so that an investor’s shares, when redeemed, may be worth more or less than their original cost. Current performance of the fund may be lower or higher than the performance quoted. Performance data current to the most recent month end may be obtained by calling 1-800-331-8936. The funds impose a 2% redemption fee for shares held less than 90 days. Performance data quoted does not reflect the redemption fee. If reflected, total return would be reduced.
A quick look at the financial statements or an automated screen of a cross-over story may give you a false impression of the underlying business. The cash cow portion of the business may be stagnant or have declining margins. Analysis focused on this portion of business may justify a lower valuation, and in the current environment may lead an investor to deem the business as “risky.” This misunderstanding of risk is precisely where we believe that the opportunity arises.
We seek to understand a company based on the entire picture because we make the effort to dig deeper and to meet with company management. Our analysis is often focused on the cross-over portion of the business, because our experience leads us to believe that this overlooked segment should drive earnings over the next 3 to 5 years. For example:
Rentrak (RENT)
Rentrak has been in the business of supplying VHS and DVDs to Mom & Pop video stores across the country for more than a decade. However, the rise of streaming video and other video-delivery options has caused this business to decline. Aware of this trend, Rentrak management diversified their business into demographic data tracking. Rentrak is now the leading provider of real-time audience data to marketing businesses. Rentrak’s crossover story is that its video-supplying business is feeding the higher growth rate and higher margin data-tracking business. We see this data-tracking segment becoming the majority of the company’s business in the future, a fact that we believe is being missed by Wall Street.
- Rentrak has been stuck in the range of approximately $100 million in revenue for multiple years.
- Revenue from the legacy business decreased in excess of 30%
- New data tracking revenue has grown from zero to in excess of $30 million.
- Margins in the data tracking business significantly higher than legacy business.
- As the company crosses over to the higher growth and higher margin data tracking business, earnings should accelerate to several dollars a share, equating to a single-digit P/E.
Landec(LNDC)
Landec has a legacy business of food packaging and distri-bution to grocery stores on the west coast. The company has developed a new line of business based on technology that extends the shelf-life of food, mainly bananas and avocados. Landec’s crossover story is that its food distribution business is feeding what could soon be a multi-million dollar recurring business with higher margins. This high growth/high margin business is being overlooked because it currently represents less than 20% of the firm’s business. However, we believe that the Breathway® segment could soon provide a major portion Landec’s overall revenue, possibly making the stock deeply undervalued to future earnings.
- Landec’s transition into the new business leads us to believe that the company can potentially possess an earnings power of $1.00, which equals a P/E in the single-digits.
“As our shareholders know, when a misunderstood company has received recognition historically the upside has been fast and significant”
Investors’ current aversion to risk has led to a significant amount of pricing inefficiencies in the micro-cap space and within our own Portfolios. In the short term this has affected performance, but we continue to have a strong conviction in our portfolios. As our shareholders know, when a misunderstood company has received recognition historically the upside has been fast and significant.
A crucial issue in determining when an under followed investment may gain recognition is the catalyst. This is something that we cannot be sure of. It could be growth rates that help micro-cap stocks gain the Street’s attention – small company growth rates could be 1.5-2 times the growth rates of larger companies, potentially helping small companies get into favor. But we just don’t know. Ultimately we are long term investors and we will continue to look for pricing inefficiencies in the micro-cap space, a task which has been getting a bit easier of late.
Small-Cap Market Overview
As we noted in our last commentary, larger market-cap names have been out-performing this year. This trend continued into the second quarter, with the largest names in the Russell 2000 Index providing a median return of 8.8%, as compared to -7.4% and -2.8% for companies under $150 MM and in the $150-$500 MM range, respectively, which is where we tend to invest.
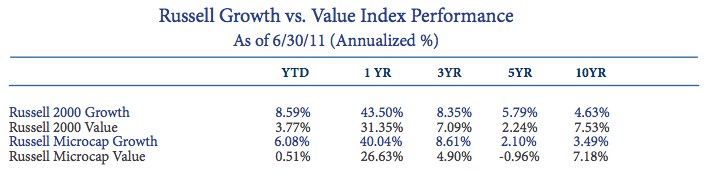
This year the market has also favored growth over value, as the Russell Microcap Growth Index has provided investors with a 6.08% return YTD as compared to 0.51% for the Russell Microcap Value Index.

We invest with a long-term horizon because we understand the cyclical nature of the market. While short term periods where our investment style may be out of favor can be difficult, these periods have often provided us with the greatest opportunities, as described in this commentary. We believe that the true measure of a manager is over the full market cycle, and in our opinion our Portfolios are well-positioned to achieve another profitable run.