

Top Ten Reasons
Top 10 Reasons to Invest in MicroCap
REASON #1: MICRO-CAPS HIGHER RETURNING ASSET CLASS IN 59 OF 69 20-YEAR ROLLING RETURN PERIODS 1926-2014
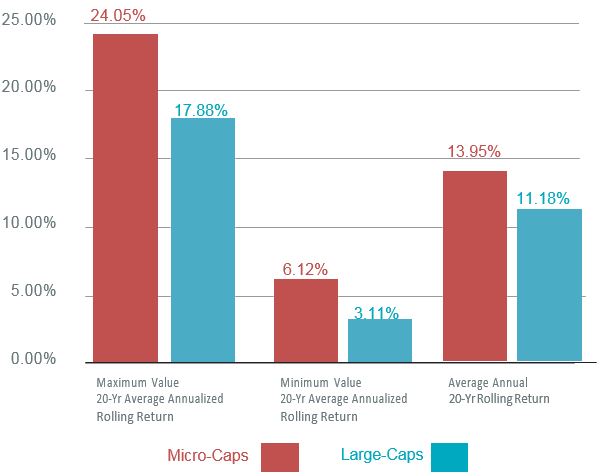
Microcap stocks defined as the bottom two deciles of securities ranked by Market Capitalization from 1926-2014. Large company stocks are represented by the S&P 500 Index.
The S&P 500 Index is an index of 500 stocks chosen for market size, liquidity and industry grouping, among other factors. The S&P 500 is designed to be a leading indicator of U.S. equities and is meant to reflect the risk/return characteristics of the large cap universe.
Source: Ibbotson & Associates Stocks, Bonds, Bills and Inflation Yearbook, 2014,
Rolling return is the annualized average return for a period ending with the listed year. For example, the twenty-year rolling return for 1995 covers Jan 1, 1976, through Dec 31, 1995. The twenty-year rolling return for 1996 is the average annual return for Jan 1, 1977, through Dec 31, 1996, etc.
REASON #2: MICRO-CAPS ARE UNDER-COVERED IN OUR VIEW
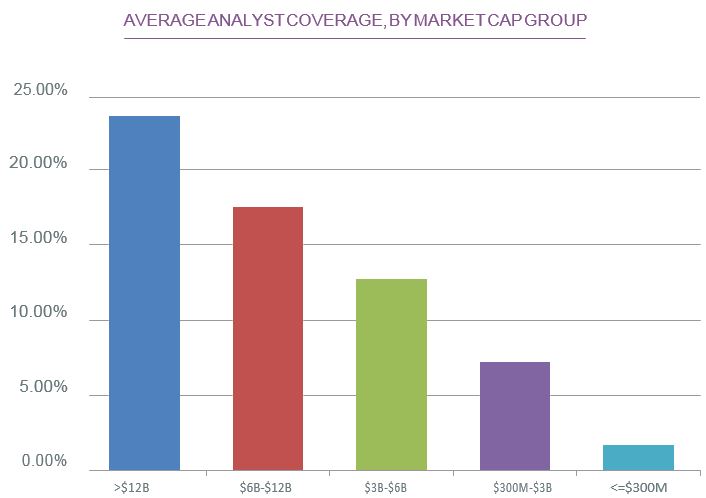
Source: Furey Research Partners, January 2014
REASON #3: WE BELIEVE MICRO-CAPS REMAIN THE LAST INEFFICIENT MARKET CAP CLASS
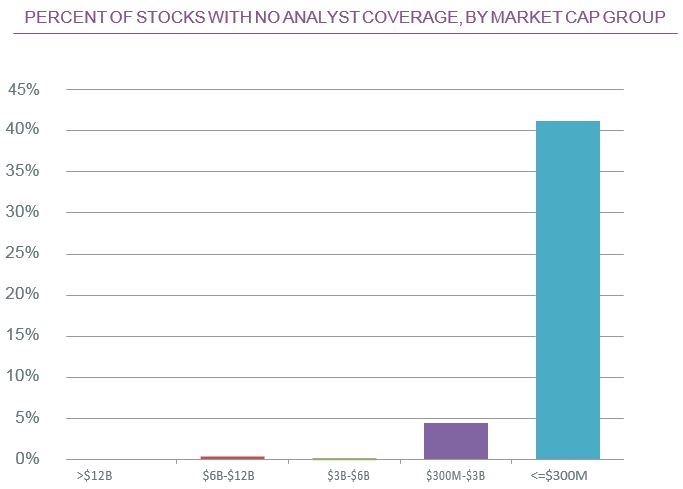
Source: Furey Research Partners, January 2014
REASON #4: MICRO-CAPS HAVE HISTORICALLY HAD A HIGH DEGREE OF INSIDER OWNERSHIP, WHICH ALIGN MANAGEMENT AND INVESTOR INTERESTS
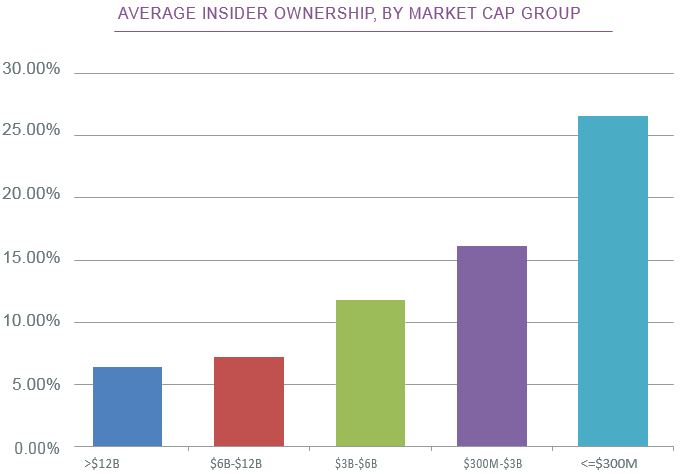
Source: Furey Research Partners, January 2014
REASON #5: SINCE 1993, OVER 50% OF ALL PUBLIC MERGERS & ACQUISITIONS TRANSACTIONS OCCURRED AT THE MICRO-CAP LEVEL
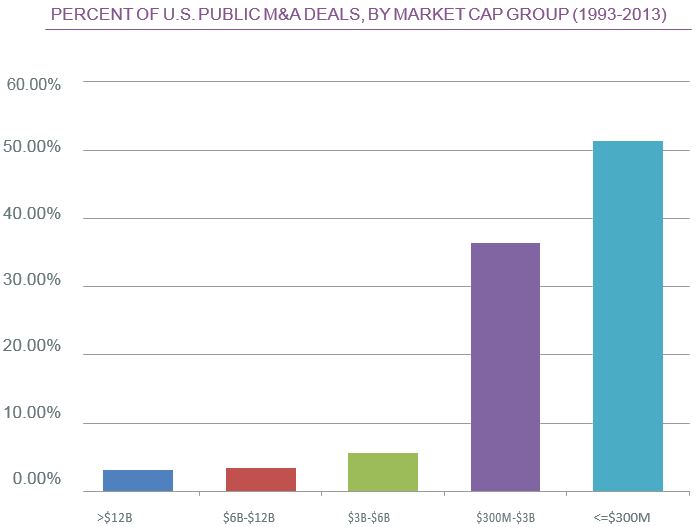
Source: Furey Research Partners, January 2014
REASON #6: MICRO-CAPS HAVE HISTORICALLY POSTED STRONG LONG-TERM RETURNS
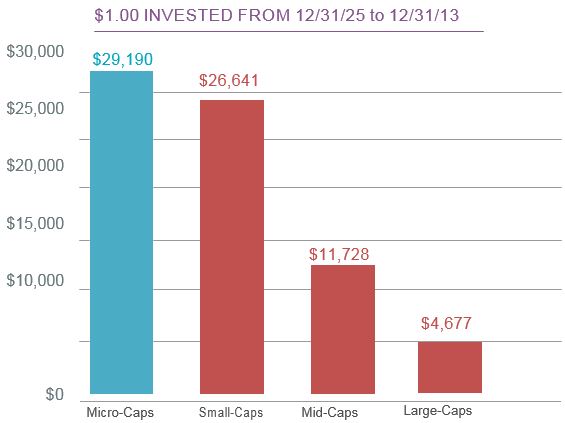
Micro-cap and small capitalization companies typically have relatively lower revenues, limited product lines, lack of management depth, higher risk of insolvency and a smaller share of the market for their products or services than larger capitalization companies. Generally, the share prices of stocks of micro-cap and small capitalization companies are more volatile than those of larger capitalization companies. Also, the returns of micro-cap and small capitalization company stocks may vary, sometimes significantly, from the returns of the overall market. In addition, micro-cap and small capitalization company stocks tend to perform poorly during times of economic stress. Relative to large capitalization company stocks, the stocks of micro-cap and small capitalization companies are thinly traded, and purchases and sales may result in higher transactions costs. A mid-cap company may be more vulnerable to adverse business or economic events than stocks of larger companies. Mid cap stocks are defined as deciles 5-6.
This chart illustrates the performance of a hypothetical $1 investment made on December 31, 1925. It assumes the reinvestment of dividends and capital gains, but does not reflect the effect of any applicable sales charges or redemption fees. The chart does not imply any future performance.
Microcap stocks defined as the bottom two deciles of securities ranked by market capitalization from 1926-2013. Small-cap stocks defined as deciles 6-8. Mid-cap stocks defined as deciles 3-5. Large company stocks are represented by the S&P 500 Index. Source: Ibbotson & Associates Stocks, Bonds, Bills and INflation Yearbook, 2014.
REASON #7: MICRO-CAPS HAVE HISTORICALLY DONE WELL IN LOW-GROWTH ENVIRONMENTS
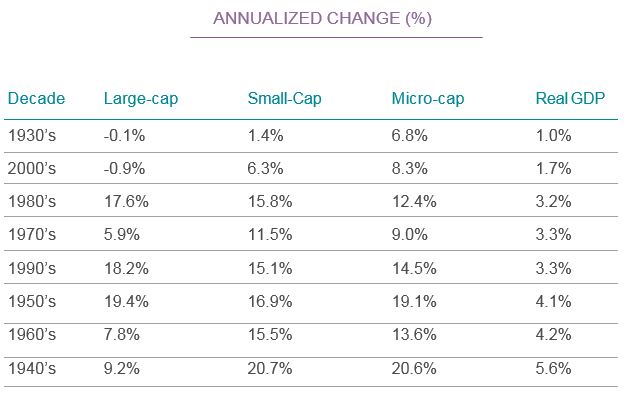
Microcap stocks defined as the bottom two deciles of securities ranked by market capitalization from 1926-2013. Small-cap stocks defined as deciles 6-8. Mid-cap stocks defined as deciles 3-5. Large company stocks are represented by the S&P 500 Index. Source: Ibbotson & Associates Stocks, Bonds, Bills and Inflation Yearbook, 2014.
GDP is Gross Domestic Product. Source: Economic Research Federal Reserve Bank of St. Lousis Crestmont Research
Past performance does not guarantee future results
REASON #8: MICROCAPS CAN LOWER CORRELATION
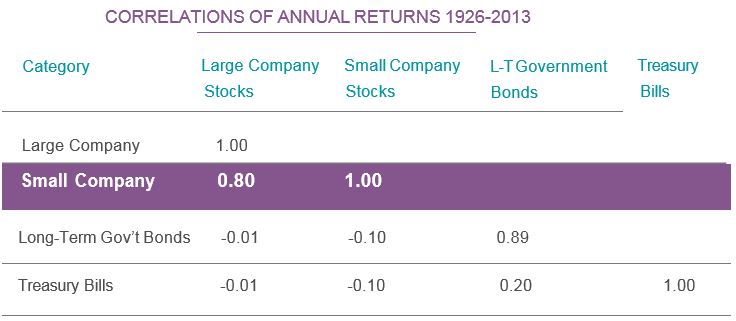
Source: Ibbotson Classic Yearbook, 2014
Small company stocks defined as the bottom quintile of securities ranked by market capitalization from 1926-1981. For January 1982 to March 2001, the series is represented by the DFA U.S. 9-10 Small company portfolio and the DFA U.S. Micro Cap Portfolio thereafter. Large company stocks are represented by the S&P 500 index. Long-term Government Bonds are constructed with data from The Wall Street Journal. To the greatest extent possible, a one-bond portfolio with a term of approximately 20 years and a reasonable coupon was used each year. For the U.S. Treasury Bill index, data from The Wall Street Journal are used. Each month a one-bill portfolio containing the shortest-term bill having not less than one month to maturity is constructed. The Consumer Price Index for All Urban Consumers is used to measure inflation Source: Ibbotson & Associates Stocks, Bonds, Bills and Inflation Yearbook, 2014.
Correlation is a statistical measure of how two securities move in relation to each other. A correlation of 1.00 equals perfect correlation, 0.00 equals no correlation, -1.00 equals perfect negative correlation.
REASON #9: MICROCAPS HAVE HISTORICALLY PERFORMED WELL FOLLOWING RATE HIKES
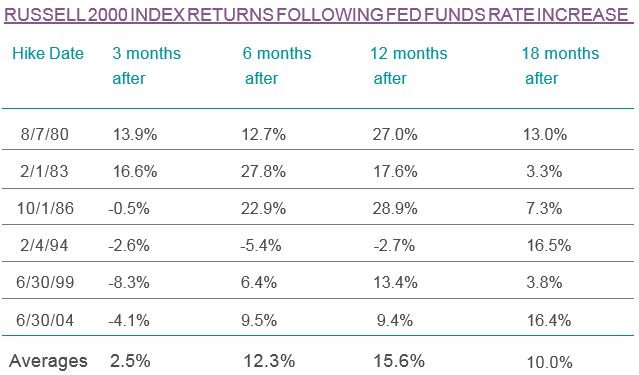
Source: Capital IQ
The Russell 2000 Index consists of the smallest 2,000 companies in a group of 3,000 U.S. companies in the Russell 3000 Index, as ranked by market capitalization.
REASON #10: MICROCAPS USE DISCLOSURES
DISCLOSURE
The Fund’s investment objectives, risks, charges and expenses must be considered carefully before investing. The Summary Prospectus and Statutory Prospectus contain this and other important information about the investment company, and it may be ob– tained by calling (800) 331-8936 or by visiting perrittcap.com. Read it carefully before investing.
Mutual fund investing involves risk. Principal loss is possible. The Funds invest in smaller companies, which involve additional risks such as limited liquidity and greater volatility. The Funds invest in micro cap companies which tend to perform poorly during times of economic stress. The Ultra MicroCap Fund and Low Priced Stock Fund may invest in early stage companies which tend to be more volatile and somewhat more speculative than investments in more established companies. Low Priced stocks are gener- ally more volatile than higher priced securities.
Index performance is not indicative of fund’s performance. Past performance does not guarantee future results. Current performance can be obtained by calling 1-800-331-8936. The Russell Microcap index is a capitalization weighted index of 2,000 small cap and micro cap stocks that captures the smallest 1,000 companies in the Russell 2000, plus 1,000 smaller U.S.-based listed stocks. It is not possible to invest directly in an index.
Invest With Us