

Research & Whitepapers
Observations of Inflation Expectations’ Effect on Risk Assets in the Post-Crisis Period
Note From The Research Desk George Metrou, CFA, Director of Research
{Having reached the zero bound for interest rates, the old ways of viewing inflation’s effect on stock prices has been turned upside down. Higher inflation expectations have been good for risk assets generally and for small-and micro-cap stocks in particular in the recent period. Behavioral analysis tells us thatinvestor expectations of inflation should be as predictive as (or more than) realized inflation when measuring opportunity in the small and micro-cap sector.}
Observations of Inflation Expectations’ Effect on Risk Assets in the Post-Crisis Period
We assert that the current market environment, characterized by dis-inflationary trends sand short-term interest rates being at the zero-bound, has turned the conversation of inflation expectations effects upside down. Specifically we observe a high and positive correlation between rising inflation expectations and risk asset prices. We suggest that although these observations are associated with rising yield pressures, this dynamic has been and may continue to be, a positive catalyst for risk assets.
Inflation expectations represent the aggregate market expectation for future inflation. Understanding the level of inflation expectations is a key factor in helping policy makers determine monetary policy, which in turn aids policy makers in keeping long term inflation expectations anchored.
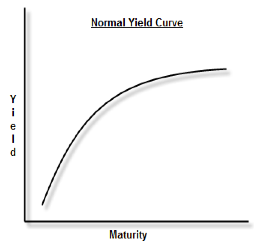
Inflation expectations can be measured from market-based information such as the term structure of interest rates, otherwise known as the yield curve. We also observe expectations imbedded in the spread between nominal and real bond yields (US treasuries minus Treasury Inflation-Protected Securities). Forecast-based expectations from market participant surveys and economists’ models can also be incorporated.
In the following analysis, we have chosen to observe a market based measure of inflation expectations calculated by measuring the spread between 10 year US treasuries (UST) and 2 year UST. We believe using market based signals provide anaccurate and less biased representation of the aggregate inflation expectations of market participants.
The course of the yield spread in the post-crisis period
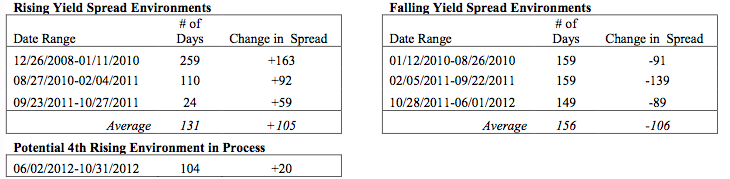
Inflation expectations (as measured by our proxy, the yield spread of 10 year UST and 2 year UST), have been on a roller coaster ride in the current era of zero interest rates. In an attempt to limit the noise of normal market movements and identify true shifts in market participant expectations, we placed a threshold on spread shifts to discern a true shift in expectations. Our threshold defines periods of rising inflation expectations and declining inflation expectations as a minimum shift of 50 basis points (bps), or one-half percentage point, in the yield spread. Using this framework, the post-crises period has been marked by three distinct periods of both rising inflation expectations and declining inflation expectations.
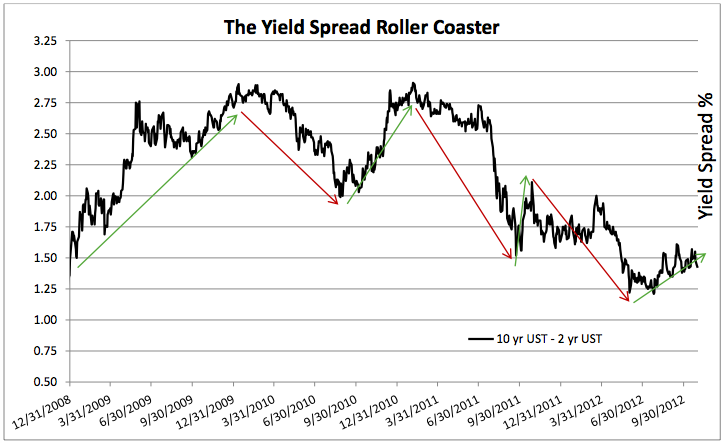
As seen above, the spread bottomed near 130bps in the final days of 2008, near the depths of market disruption. By early 2010, after rising for over a year, the yield spread had dramatically increased to a high of 290bps. A persistent decline followed, culminating with the spread bottoming near 200bps in August of 2010. The spread then surged into the spring of 2011, again reaching over 290bps. It remained elevated for a number of months prior to collapsing in the early fall of 2011. Note that this collapse occurred, a long with a great deal of financial market distress, around the time the US Congress staged a showdown over the debt ceiling. Resolution of that turmoil led to a brief and rapid rebound in the spread only to fall off again in the spring of 2012. Finally, in the summer of 2012 we observed a spread at the lowest point since the Federal Reserve lowered the target fed funds rate to zero. Below we define each of the three distinct periods of both rising spreads and falling spreads, including the length of each period and the respective averages.
We believe that after bottoming early this past summer the spread has begun a fourth expansionary phase. In our estimation, the yield spread expansion is beginning from a compressed level. The recent lows reached 122bps, which is even below the lows of late 2008. For this reason, we suggest that the yield spread, representing inflationary expectations, may expand with greater duration and a greater magnitude than the average of the previous rising spread environments.
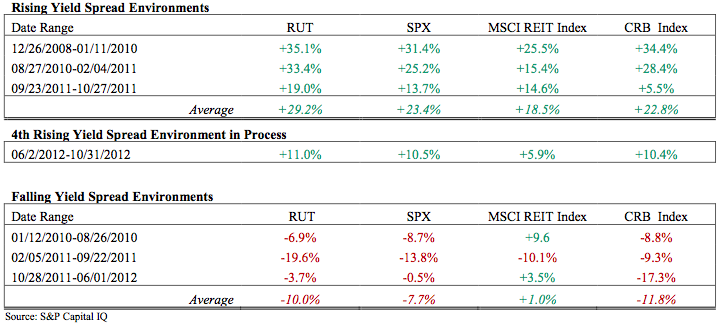
There is a high and positive correlation between risk asset performance and rising inflation expectations, as seen in the table below. US small cap equities returned on average 29.2% and were the best performing asset class. Following this, we observed average returns for the S&P 500 of 23.4%, commodities of 22.8%, and real estate assets of 18.5%. At present, the most recent environment of rising spreads has confirmed the relationship between higher inflation expectation and positive risk asset returns.
In the second table we can see the results that correlate with declining inflation expectations. When inflation expectations are falling all four risk asset classes perform decidedly worse.Commodities were affected the most declining an average of -11.8%, closely followed by the Russell 2000 (-10.0%) and the S&P 500 (- 7.7%). Real estate does show a marginally positive return in falling inflation expectation periods, but we point out that the return difference for real estate between the two environments is supportive of our thesis.
Beyond the correlation seen in the data above, our suggestion that risk assets are responding to rising inflation expectations also relies on our sense that it is a diminishing fear of the opposite, a deflationary outcome, which is motivating investors. Deflation has continued to loom following the disruption in financial markets, the economic recession, and even now during a sub-par recovery. This has been a primary concern among market participants and policy makers alike. These deflationary fears are supported by the fact the US has continued to experience repeated disinflationary trends despite the stimulative effects of monetary easing and fiscal support over the past four years.
Deflation and all of its detrimental effects (worsening economic output, corporate earnings, household finances, and asset prices) was well demonstrated in Irving Fisher’s 1933 paper on the subject, “ The Debt Deflation Theory of Great Depressions.” Increased inflation expectations result in less fear of deflation, which subsequently leads investors to anticipate higher nominal spending, higher nominal cash flows for corporations and a lower probability of deflationary shocks for a levered economy.
In our view, the reduction in risk of a deflationary scenario is the factor exerting the most impact on risk asset prices. It is with that view that we would also state that inflation is no panacea. We do not view wealth through a nominal lens. The drawing on the first page of this report, although a cartoon, represents a serious issue. We do not desire an inflationary moneyball to be shot at the markets. Although we have asserted that convention has been turned upside down with respect to the view of inflation, we are not stating any type of “this time it’s different” argument. We merely assert that given the present set of circumstances, rising inflation expectations are supportive of risk asset prices, particularly US small cap equities. Prior notions regarding inflation’s negative effects on equity prices are invalid given the current market landscape.
To test this, we ran the same inflation expectations analysis using nominal and real bond spreads, or “TIPS spreads,” for treasury bonds of equal tenor. This, in theory, isolates the inflation premium more clearly than that of a nominal yield spread between two different maturities. The results were virtually the same. TIPS spreads also show rising inflation expectation periods were positive for risk assets.
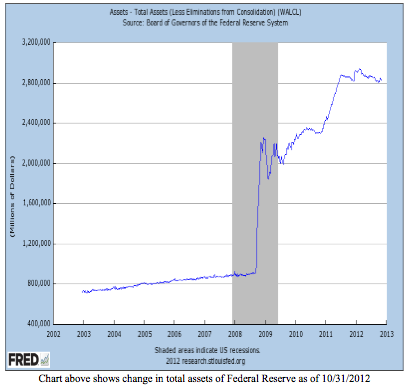
We choose to use our methodology over the TIPS spread for two reasons. First, we have seen some criticism in using the TIPS market indicator because of that market’s relative lack of liquidity compared to that of the UST market. Second, given that yields for TIPS have been low for years (and are outright negative today), it suggests a confirmation that the growth premium has been and is currently nil. Given that fact, we do not believe that we are conflating growth and inflation expectations when using the 10 year UST and 2 year UST spread. Furthermore, the circumstantial evidence of the timing of the shifts in the yield spread with expansions of the Federal Reserve’s balance sheet are too close for us to not suspect inflation expectations as the primary driver.
US Federal Reserve balance sheet activities
Since the onset of the crisis, the Federal Reserve Bank of the United States has engaged in numerous unconventional and controversial policies in an effort to combat the crisis and facilitate a faster recovery. Chief among these unconventional policies has been the Fed’s expansion of its balance sheet to purchase assets. Formally called Large-Scale Asset Purchase Programs, or LSAPs, the programs are commonly referred to as quantitative easing or QE for short. The Federal Reserve has previously engaged in two sets of outright purchase programs (QE 1 and QE 2), one term altering program (Operation Twist), and announced on September 13, 2012 the launch of a third LSAP program (QE 3). The table below illustrates the announcement dates, target securities and program sizes, duration, and average monthly purchase pace in the table below:
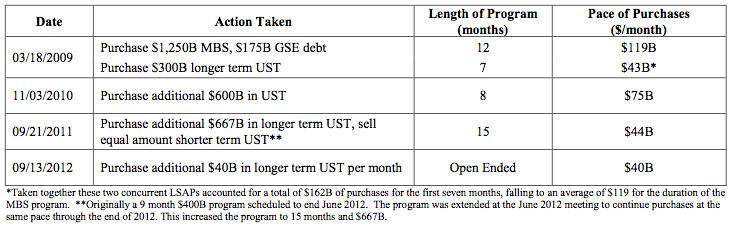
We do not intend to critique the actions of the central bank, argue for or against the efficacy of its programs, or to propose policy prescriptions of our own. We must observe the present situation and respond accordingly. With that said, it does not take much to notice that each of the separate periods of rising inflation expectations we identified began near the launch of each new LSAP. The only minor exception is the second period, corresponding to QE 2, where rising inflation expectations were ahead of the commencement of the program by roughly two months and closely coincided with Ben Bernanke’s 2010 Jackson Hole speech. It was in that speech he referred to the possibility of an additional round of asset purchases.
We admit we are aware of some strategists pointing out the diminishing effects of each successive round of QE. We agree with that assessment. However, we point out that it appears as though this has been a deliberate strategy of the Fed. This is possibly in light of their assessment of the benefits and risks of QE, as each successive program has seen a reduced pace of purchases on a monthly basis. With respect to the most recently announced round of asset purchases, QE 3, we expect inflation expectations, and in turn risk assets, to respond as they have during prior purchase programs. We may however, be wrong. We believe that is a reason the Fed made this third program open-ended, which is a dramatic departure from previous policy. An open-ended QE program gives the Fed the flexibility to scale up the pace of purchases (increasing the flow of the program) or run the program longer (increasing the total stock of purchases) than would a fixed size program. It is this characteristic of the latest round of asset purchases that gives us high confidence that it will affect inflation expectations and those expectations in turn affect risk assets positively.
Lastly, and only slightly reneging on our attempt to avoid passing any judgment on the Fed’s actions, we again reference Fisher’s Debt-deflation Theory. Fisher wrote, “Unless some counteracting cause comes along to prevent the fall in the price level, such a depression as that of 1929-1933 (namely when the more the debtors pay the more they owe) tends to continue, going deeper, in a vicious spiral, for many years. There is then no tendency of the boat to stop tipping until it has capsized.” We argue the Fed’s policies are indeed the counteracting cause.
Ben Bernanke, in reference to comments he made in a 2003 speech titled, “Deflation: Making Sure ‘It’ Doesn’t Happen Here,” has at times been referred to as “helicopter-Ben.” The particular policy prescription he was suggesting to combat a deflationary liquidity trap that earned him this moniker involved the fiscal and monetary authorities working together to deploy a central bank financed tax cut. This type of policy was likened to a “helicopter drop” of money. We find this interesting, because in actuality Bernanke was only referencing, and specifically cited, the original contributor of this idea: Milton Friedman. Recently, in the Q&A following a speech at the Economic Club of Indiana, Bernanke suggested that Milton Freidman would have been supportive of the Fed’s current policies. Bernanke was lampooned in some corners of the financial media as though he had defamed Friedman’s character. Writing on his blog, Economist David Beckworth a professor at Western Kentucky University, pointed to a Q&A done by Friedman himself in 2000 in which he had the following exchange: David Laidler: Many commentators are claiming that…with short interest rates essentially at zero, monetary policy is as expansionary as it can get, but has had no stimulative effect on the economy. Do you have a view on this issue? Milton Friedman: Yes, indeed. … the situation is very clear. It’s very simple. They can buy long-term government securities, and they can keep buying them and providing high-powered money until the high powered money starts getting the economy in an expansion. What [the economy] needs is a more expansive domestic monetary policy.”
Conclusion: Judging the beauty contest
The market today is operating under a new set of rules. The extreme events over the past four years have pushed investors and policy makers to question their prior assumptions and attempt to find new tools to comprehend the current environment. In the past, investors relied on the assumption that rising inflation expectations would lead to yield pressures or rate hikes, which were seen as equity negative. We argue that today’s circumstances of a central bank holding short term rates at zero percent and a persistently disinflationary environment have turned that conventional thought upside down. Through analyzing the performance of various risk assets during three distinct periods of rising and falling inflation expectations, we have concluded that rising inflation expectations are positive for risk assets, US small cap equities in particular. We view a high possibility that we have recently entered a fourth period of rising inflation expectations and that this period will be prolonged.
It is at this point that we may be sometimes tempted to hesitate to follow our own research. What if the market is wrong? What if the Fed policies are more harmful than helpful? What if this happens? What if that happens?! We admit that we don’t know and we cannot predict the future. Yet our work is to identify the best course of action given the circumstances.
In times like these we are reminded to follow the advice of John Maynard Keynes, not, with all due respect, Benjamin Graham. Keynes said we should think of the market as a beauty contest, and we a member of the judges’ panel. The goal is not to decide for ourselves what we individually think beauty is, but only to be among the judges who pick the winning contestant. It is then we will be able to claim our great ability to detect true beauty. The wonderful thing about being a “panel judge” today is that we can look at prior contests and come to conclusions about what the other judges found beautiful. In our case, it is our judging duty to look at history and determine what the markets have deemed to be the highest beneficiary in certain environments, the prettiest asset.
Graham said the market was like a voting machine tabulating the results with each investor being a voter. Even being steadfast in the belief of the correctness of our vote, casting a lone vote, or even a losing vote, wins us no prize. If we were “voting” in the market, we may be tempted to cast a vote that incorporates our own biases, predispositions, or faulty assumptions.
The interesting aspect about thinking of the markets as a beauty contest is that it relies on the perception of the collective wisdom of the market to ascertain beauty. This is ironic because the markets, the life blood of free market capitalism and the central domain of individual risk takers, are indeed ruled by this collective wisdom. The results of the beauty contests we have watched over the past few years, when judged by the desirability of risk assets during periods of rising inflation expectations, have shown that the judges vote enthusiastically. And that the crown has gone to US small cap equities.
Addendum
Anticipating inquiries surrounding what the above analysis*, specifically the outperformance of equities during easing periods, may imply about the magnitude and duration of this bull market. A fear being that we have gone, “too far, too fast,” and the market is a product of little more than Fed manipulation. We present the following chart. If you would like to speak to our team regarding current and historical valuations, please contact us.
Sources:
1 Bernanke, Ben. “Monetary Policy since the Onset of the Crisis” speech delivered at the Federal Reserve Bank of Kansas City Economic Symposium, Jackson Hole, WY, August 21, 2010
2 Bernanke, Ben. “An Unwelcome Fall in Inflation” speech delivered to the Economics Roundtable, University of California, San Diego, La Jolla, CA, July 23, 2003
3 Federal Reserve System Monthly Report on Credit and Liquidity Programs and the Balance Sheet, August 2012. http://www.federalreserve.gov/monetarypolicy/files/monthlyclbsreport201208.pdf
4 Fisher, Irving. “The Debt Deflation Theory of Great Depressions,” Econometrica (March 1933) pg. 337-57.
5 Friedman, Milton. “Canada and Flexible Exchange Rates” keynote address delivered at the Bank of Canada Conference on Revisting the case for Flexible Exchange Rates, November 2000.