Manager Commentary-Archive
Manager Commentary, 4th Quarter 2015
WALL STREET PUTS STOCKS ON SALE
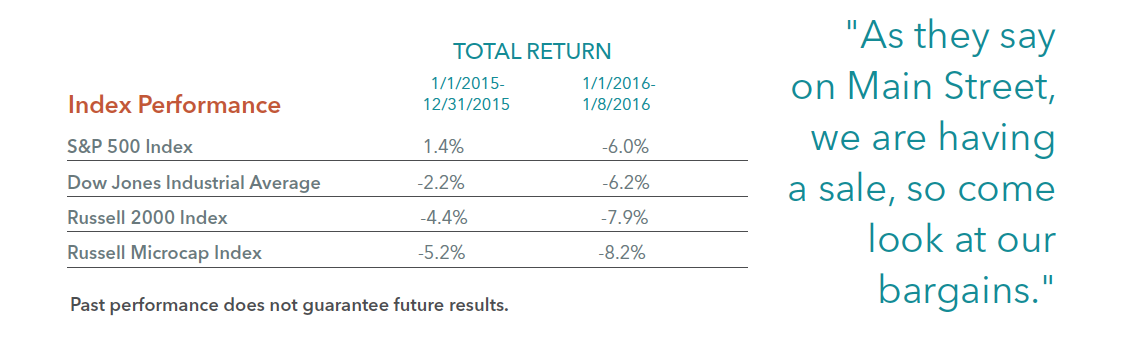
As they say on Main Street, we (retailers) are having a sale, so come look at our bargains. I have always found it fascinating that sales in retail or Main Street are met with cheers and excitement, but sales on Wall Street are met with gloom and depression. Before we consider the “bargains” on Wall Street, let’s take a look at how the stock market has performed recently.
As measured by the S&P 500 Index and the Dow Jones Industrial Average, large stocks experienced their biggest fall ever for the first five trading days of January and the worst for any week since September 2011. The Dow Jones Industrial Average lost 6 percent and the S&P 500 Index lost 6.2 percent in the first week (1/1-1/8/16) of January 2016. Thanks to dividends, the S&P 500 Index eked out a 1.4 percent gain in 2015, but the Dow lost 2.2 percent. Smaller stocks fared even worse. The Russell 2000 Index lost 7.9 percent in the first week of January while the Russell Microcap index lost 8.2 percent. These declines came after losses in 2015 for both the Russell 2000 Index and the Russell Microcap Index. As we have said several times in the past, the small-cap market has been in a stealth bear market, but this decline in the Russell Microcap Index officially puts that index in bear market territory. The complete index performance numbers can be viewed in the table below.
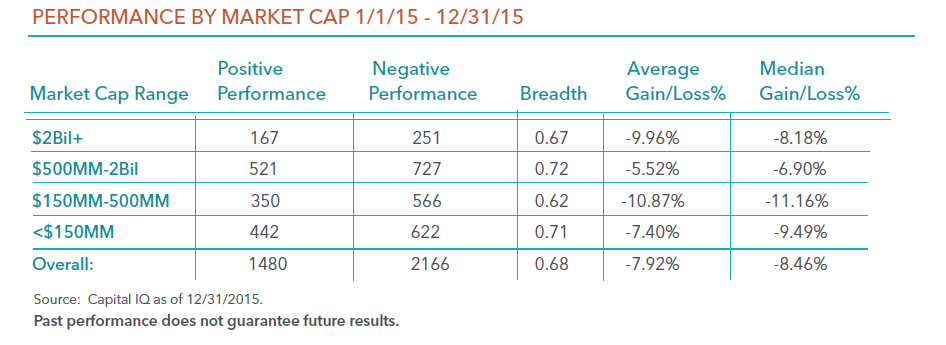
Here is a review of the breadth of the smaller-cap market. As the table below indicates, the average stock once again performed worse than that of the small-cap indexes. The table shows that 2,166 stocks declined last year and 1,480 stocks rose last year. The table does not show that the majority of stocks that rose last year were lower quality stocks in our opinion. In addition, the majority of the 2,166 stocks that declined last year were very severe. In other words, the majority of the declines were in the bear market zone (greater than 20%).
SECOND HALF QUALITY COMEBACK
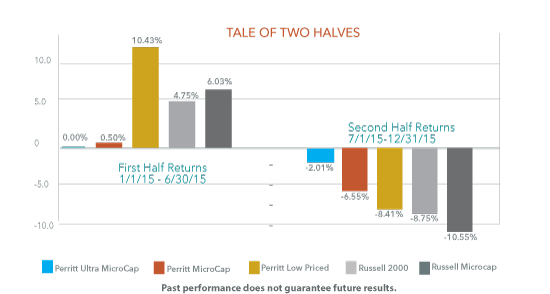
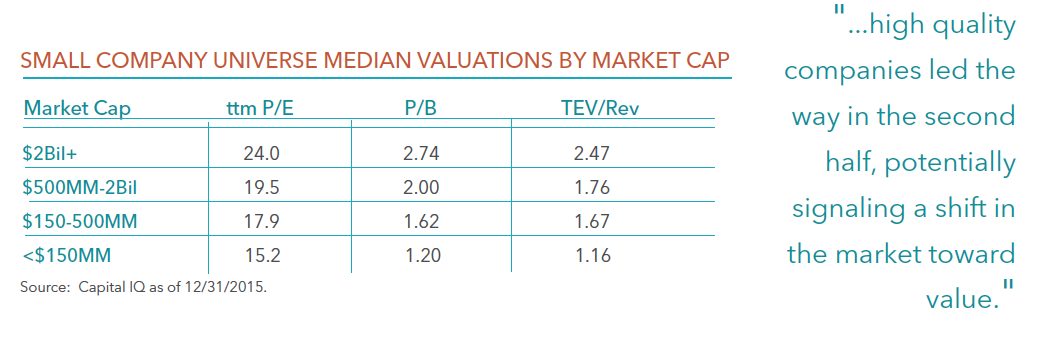
The small and micro-cap stock market in 2015 can be viewed as a tale of two halves. Small-caps (Russell 2000) posted 4.8% return in the first half of the year (Jan-June) and -8-8% in the second half (July-December). Micro-caps (Russell Microcap Index) also gained in the first half (6.0%) before falling harder in the second half (-10.6%). Looking under the hood, investors will find that high quality companies (positive EBIT, dividend, positive earnings growth) led the way in the second half, potentially signaling a shift in the market toward value. Lower quality companies (negative EBIT, no dividend, negative earnings growth) drove returns in the first half when biotech and internet companies were far in favor.
We believe recent trends bode very well for active managers of small- and micro-cap stocks. The biotech segment of the market has started to show signs of stress, dragging index performance down with it. As we started to see in the second half of 2015, active managers that focus on quality companies can provide investors downside protection. And there are many opportunities with attractive valuations, as we discuss next.
Why have stocks declined severely recently? There are certainly some weakness in some economic indicators, but not all indicators. For example, the Purchasing Managers’ Index ticked below 50, which can be an indication of future weakness in the economy. However, jobs creation and unemployment has both been moving in a positive direction. The Federal Reserve finally raised interest rates last month, which some say could slow growth further. We, however, believe that a one-quarter interest rate hike or even a couple more will have very little impact on the economy. The real decline in stocks, in our opinion, is related to the China market. While the China market does have an impact on the world economy, we believe smaller stocks are not influenced by the China economy. In fact, the majority of the companies in our portfolios have no exposure to China. This brings us back to one of the “bargains” on Wall Street.
Our largest holding firm wide is Atlas Financial (AFH), which is the largest insurance provider to cab companies and other transportation companies (yes, they do some business with Uber). Not only do we see no impact from China, we believe AFH’s business will be hardly hurt from a weaker economy. The company’s stock has declined recently by more than 15 percent from its recent high, but the business in the past few years has grown well in excess of 20 percent, and we don’t see that growth rate stopping. AFH shares trade for a little more than 10 times 2016 earnings estimates as of 12/31/2015.
As I said earlier, Wall Street sales are typically met with gloom. A look at domestic equity flows gives us some insight on this phenomena. According to Investment Company Institute, domestic equity flows were negative by $170 billion in 2015, and negative by $60 billion in 2014. While the large-cap market did well in 2014, the last year smaller-cap stocks did well was in 2013. It does not surprise us that the domestic equity flows in 2013 were modestly positive by $18 billion. The more interesting part of the flows are in the trends. A deeper look shows that the domestic equity flows only started to turn positive late in 2013, after the markets had rallied. Today, the domestic equity outflows have been accelerating. The weekly domestic equity flows have been in excess of $5 billion several times recently, which means we could be on pace for more than $200 billion annually in domestic equity outflows, just as we enter bear market territory. Once again, this behavior does not surprise me, but it seems odd given the bargains on Wall Street. So, lets look at the “bargains”.
Regardless of the valuation characteristics you use, valuations are more attractive for smaller-cap stocks versus that of larger-cap stocks. The table above breaks down the smaller-cap market by market-cap buckets. While the valuations for smaller stocks are not the lowest in history, they are more reasonable than larger stocks. For example, companies with market caps above $2 billion trade at price to book values near 2.7 times, while companies with market-caps less than $500 million trade at less than 1.6 times book.
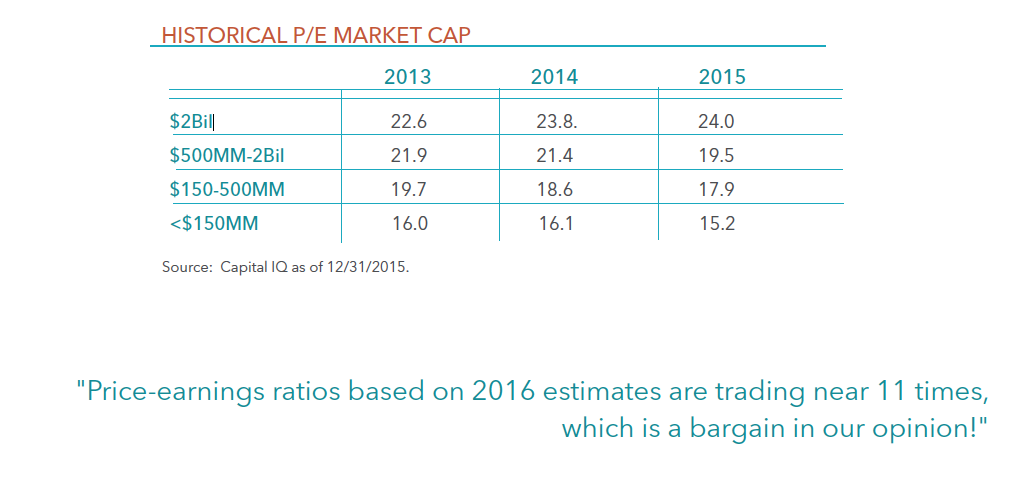
Valuations also look more attractive for smaller stocks from just a few years ago. The table below shows the price earnings ratios of those stocks by market-cap buckets for the past three years. These valuations don’t take into account the 8 percent decline in the first week of January 2016. So, the two smallest market-cap buckets are now estimated to be trading at price-earnings ratios of 14 or less. In addition, according to Capital IQ, analysts estimate that earnings will grow well into the double digit levels this year. Therefore, price-earnings ratios based on 2016 estimates are trading near 11 times, which is a bargain in our opinion!