Manager Commentary-Archive
Manager Commentary, 4th Quarter 2013
Why Invest In Micro-Cap?
Numbers Speak Louder Than Words: 2013 Review
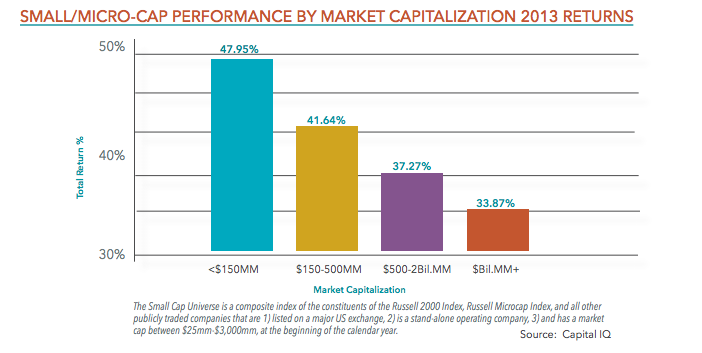
“Why should I include micro-cap as part of my small-cap allocation?” It is a question we hear often from investors. The answer is that, since 1926, micro-cap investments have increased the return and reduced correlation within a diversified portfolio (as documented by Rolf Banz & Ibbotson & Associates1). Ask an investor to consider the benefits shown in 87 years of data, however, and you’ll quickly see their eyes begin to glaze over. The rewards of investing in micro-cap are easier to understand when you look closely at a period when micro-caps began to perform well. Last year was certainly part of this cycle, as we will see below:
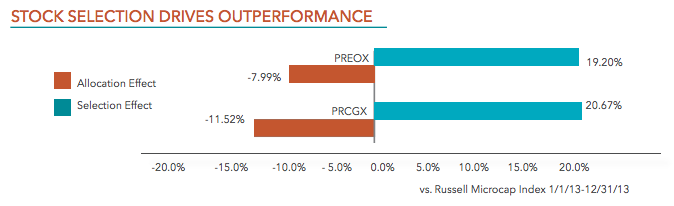
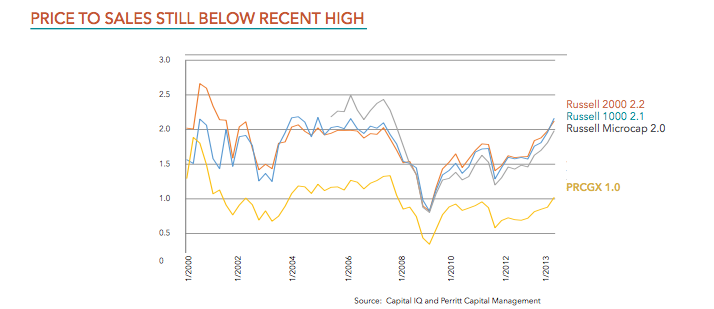
The chart below illustrates why we believe it makes sense to include micro-cap within a small-cap allocation.
We believe that the inefficiencies that exist in the micro-cap asset class make it a good place for active management. After a few years where active management lagged, the trend shifted in 2013. With certain companies becoming too expensive in our opinion (and the Russell Microcap Index’s nearly 30% weight to Financials), we believe this trend can continue.
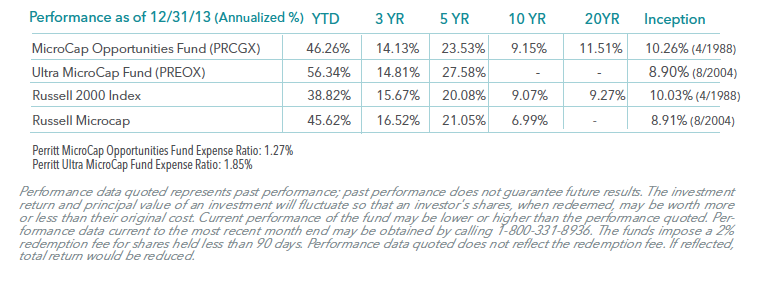
Please click fund for annualized performance; PRCGX, PREOX and PLOWX.
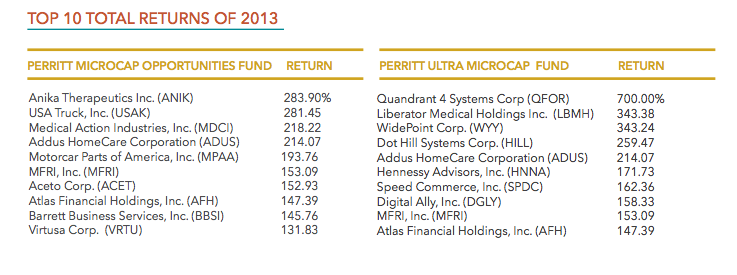
80/20 Rule: Big Winners Drive Returns
Current standardized performance of the Fund and performance data to the most recent month end may be obtained by clicking here. It is not possible to invest directly in an index.
As is usually the case in micro-cap investing, the investments that worked best accounted for much of the overall return. By the end of the year, we had taken profits on all of the below names to reinvest in what we believe could be next year’s winners.
Valuations Still Below Recent Highs
Price-to-Sales Ratios for are still below recent highs. For a more detailed analysis of recent valuations see our recent research paper: Are Micro-cap stock valuations high or low? Maybe both.
Attribution Analysis
MicroCap Opportunities Fund (PRCGX)
- The MicroCap Opportunities Fund gained 46.26 for the year, outperforming both the Russell 2000 and the Russell Microcap Indexes.
- Stock selection was the key driver of outperformance. As seen in the table above, stock selection accounted for nearly 20% of relative performance. This is largely attributed to the 80/20 rule as discussed in this commentary.
- Stock selection was most pronounced in the Financials and Health Care sectors. Bank of the Internet (BOFI) and Virtus (VRTS) were financials positions which were sold due to valuations after gaining 129% and 93% for the portfolio, respectively. Two of the Fund’s top five performing investments were Health Care related: Addus (ADUS, 214% return) and Anika (ANIK, 284%).
- Stock selection accounted for positive relative returns in 8 out of 9 sectors, indicating that our bottomup investment process was certainly a success in 2013.
- While our allocation effect was negative in all but 3 sectors (Financials, Industrials, and Utilities) we believe this emphasizes the fact that we are not closet indexers and look to invest in opportunities with out regard to the Index’s weighting.
Attribution Analysis
Ultra MicroCap Fund (PREOX)
- The Ultra MicroCap Fund gained 56.34% in the year, versus 45.62% for the Russell MicroCap Index.
- We always stress the difficulty of comparing this fund to a benchmark as it invests in companies far below the traditional radar, as demonstrated by its median market capitalization of just $79 Million (as of 12/31/13).
- Stock selection accounted for nearly 20% of relative outperformance. Financials and Technology were the best performing sectors.
- The top five contributors added 12.3% to the fund’s return while the bottom five detracted only 3.7%. This illustrates how our diversified approach of holding 100+ names and starting positions at just 0.5% -1.0% of the portfolio can provide downside protection.
- True to our philosophy when launching this strategy, the fund has tended to behave differently than the markets this year, as seen in the beta vs. the Russell Microcap of 0.71 & r-squared of 0.74.