

Manager Commentary-Archive
Manager Commentary, 4th Quarter 2012
Where’s the Breadth?
A Closer Analysis of a Strong Year for MicroCap
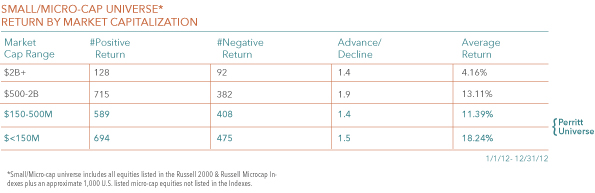
The year 2012 is now in the history books, and while returns in the small/micro-cap space were certainly a pleasurable read, we are also reminded of the old advice “don’t judge a book by its cover.” Despite our strong returns over the past year for both of The Perritt Funds, we believe that more opportunity may exist in our space. Valuations appear attractive, small businesses are growing, and an analysis of underlying index returns reveals how the small/micro-cap universe has not had the kind of broad-based run that has historically provided the best return environment for active managers. The 2012 return of the Russell Microcap Index was concentrated in a small number of sectors and securities, as we detailed in our last commentary. At year end, more than 35% of the Index’s return was due to the contribution of just two sectors: Biotechnology and Commercial Banks/Thrifts. The trend that a relatively small number of companies are driving the returns of the small/microcap space is more pronounced as you go down the market-cap scale. As shown in the table below, when we look beyond the Index and take a close analysis of our proprietary small cap universe, the advance/decline ratio was 1.5 or lower among companies with a market capitalization of $500 million and under. Historically, during a robust and healthy advance for micro-cap equities, this number has generally been much higher.
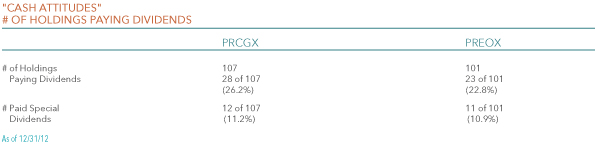
If we are to see the kind of improved breadth among micro-cap companies associated with a healthy advance, what will spark the investor confidence needed to get us there? One potential answer is the continued improvement of Cash Attitudes among management teams. We saw very healthy use of cash by companies in our portfolios at the end of 2012, although not in the way we predicted. More than 10% of companies in each of our Funds paid a special dividend at the end of last year.*
“…The small/micro-cap universe has yet to have the kind of broad-based run that has historically provided the best return environment for active managers.”
In fact, the Perritt MicroCap Opportunities Fund received 150% more dividend income during the last two months of the year than during the first ten months, primarily due to special dividends. Management teams decided to pay special dividends in large part because of the imminent tax increase on dividends (most of the companies we invest in have high insider ownership). Dividend payouts were also related to high levels of cash on balancesheets, which is a result of our process of investing in financially sound small companies.
The unparalleled payout of special dividends we saw last year is a shareholder-friendly action that we believe should bring positives to the capital structure of many micro-cap companies we invest in. First and foremost, small companies continue to improve their top and bottom lines. However, the excess cash held by many of the companies in our portfolio has driven down returns on equity, negatively affecting the P/E ratio investors are willing to pay. For example, RCM Technologies (RCM) is a company we own which has been in the $5.00-6.00 range while having $2.50 in cash per share. In December, RCM paid a special dividend of $1.00 per share, equal to one-sixth of its stock price, which will also increase the company’s ROE by a similar amount. With a lower shareholder equity number, the company’s future growth will show a greater improvement in ROE with less cash on hand. In the case of many micro-cap companies which fly so far under the traditional Wall Street radar, these kinds of actions can be the catalyst which sparks interest in the underlying business quality which has in fact been there all along.
We can’t finish without a mention that the Russell 2000 Index has reached a new all time high and a discussion of what this might mean for small/micro-cap investors. In our view this is again related to the issue of breadth. That the Russell 2000 Index hasreached new highs despite the fact that returns have been concentrated in a small number of names indicates that there may be opportunity for a more broad-based advance. Having avoided the ‘fiscal cliff ’ and with tax changes now settled, many management teams that we have met with are saying that uncertainly is declining, allowing them to better plan and execute their growth strategy. Smaller company stocks tend to demonstrate serial correlation, meaning that strong performance has historically been followed by periods of similarly strong performance. We will outline serial correlation in a new research paper later in the first quarter.
“The unparalleled payout of special dividends we saw last year is a shareholder-friendly action that will bring positives to the capital structure of many micro-cap companies we invest in.”
Attribution Analysis
Click here for standardized fund performance.
Performance data quoted represents past performance; past performance does not guarantee future results. The investment return and principal value of an investment will fluctuate so that an investor’s shares, when redeemed, may be worth more or less than their original cost. Current performance of the fund may be lower or higher than the performance quoted. Performance data current to the most recent month end may be obtained by calling 1-800-331-8936. The funds impose a 2% redemption fee for shares held less than 90 days. Performance data quoted does not reflect the redemption fee. If reflected, total return would be reduced.
MicroCap Opportunities Fund (PRCGX)
- The MicroCap Opportunities Fund gained 2.78% versus 1.85% for Russell 2000 Index and 0.04% for the Russell MicroCap Index during the fourth quarter. For the year the Fund returned 16.87% versus 16.35% and 19.74% for the Indexes, respectively.
- Stock selection was strong for the year, contributing 5.82% to relative returns versus the Russell 2000 Index and 4.12% versus the Russell MicroCap Index. Six of the Fund’s nine equity sectors added to relative performance (one sector, Telecom, had no impact).
- Stock selection was most pronounced in the Health Care and Financials sectors. Returns in the Health Care sector were driven by a nearly 100% return in top 5 holding BioScrip (BIOS). Financials returns were strong across the board, with over 75% of Financials holdings contributing to absolute returns.
- Despite the fact that Financials names we did invest in worked well, overall strength in the Financial sector overall detracted from our relative performance due to our significant underweight relative to the Index. Nearly 30% of the Russell MicroCap Index is now allocated to Financials. As discussed previously, more than 35% of the return of the Russell Microcap Index was concentrated in a small number of Biotech, Regional and Thrift Banking and stocks.
Ultra MicroCap Fund (PREOX)
- The Ultra MicroCap Fund gained 1.91% versus 0.04% for the Russell MicroCap Index during the second quarter. The Fund returned 11.79% for the year versus 19.70% for the Index.
- We always stress the difficulty of comparing this fund to a benchmark as it invests in companies far below the traditional radar, as demonstrated by its median market capitalization of just $50 Million (the lowest of all 8,163 equity Funds, accord-ing to Morningstar as of 1/28/12)
- Overall stock selection was positive, contributing 3.45% to relative performance for the year. The best performing investment was John B Sanfilippo & Son’s (JBSS), maker of Fisher Nuts. After trading at 0.1 times sales and 0.5 times book value earlier in the year JBSS began to gain traction after price increases took hold and margins expanded. We continue to be long term investors in JBSS and remain confident in this management team.
-
Stock selection gains were outweighed by negative contribution from holdings in the Technology and Materials sectors, both in terms of stock selection and sector allocation. Our relative overweight in Technology companies demonstrates our conviction in the strong upside opportunities currently found in more cyclical industries, especially in the sub-$50 million market cap range.