

Manager Commentary-Archive
Manager Commentary, 3rd Quarter 2013
Should I Stay or Should I Go?
Evaluating MicroCap Valuations in a Rising Market
Both of our microcap funds reached all-times highs during the quarter. As
we explained in our research paper Deja vu All Over Again: Serial Correlation
and Micro-Cap Equities, investors shouldn’t be surprised that micro-cap
stocks have continued to provide rewards after a strong year in 2012. Periods
of strong micro-cap performance, such as what began last year, typically last
several years or more.
Following our recent strong performance, however, many investors are asking
us if valuations have become stretched. We can answer this by showing how
we examine valuations as part of our investment process. Simply put, the question we ask ourselves when deciding if we should let a winner run is: “can this become a multi-billion dollar company?”
When is a 20 P/E Too High?
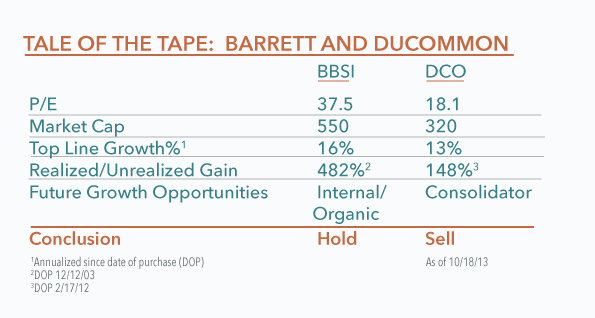
When a previously underfollowed company begins to attract the market’s attention the gains can be significant, prompting us to decide if it is time to “feed the chickens,” or sell the stock to the next tier of small- or mid-cap investors. However, some companies can justify P/E ratios of 20 or 30 if future growth opportunities remain compelling. Others, as we show below, cannot.
Barrett Business Services (BBSI) is an example of a company that we believe still has significant upside despite a higher P/E. Barrett helps HR departments of small-and mid-size companies outsource management and reduce cost inefficiencies. We first purchased the stock nearly ten years ago at $5 and a market cap of $55MM. Today Barrett is over $70 and the market cap is $550, but the company’s upside is still exciting. Barrett is growing its top line near 20%
and has done so consistently over the past decade. Despite this growth, the stock was stuck between $15 and $20 for many years until an overhang of shares was removed by management earlier this year, serving as a major catalyst for price appreciation.
Today, Barrett operates only on the West Coast, and the company is beginning to expand East. We believe the recent surge in price is only a reflection of the company’s true value that was previously mispriced. If Barrett can execute its expansion East, it can become a multi-billion dollar company, and investors would be rewarded from here.
Ducommun (DCO) is an example of a company that we decided to sell because of valuations, despite it being a recent winner in the portfolio. Ducommun provides components to the aerospace and defense industry including companies like Boeing. The company’s growth has been very impressive, expanding its market cap from $150 when we purchased it to over $300MM today. Much of this growth was bought through acquisition, however, as opposed to internal growth. We benefited from this consolidation play but future opportunities depend on the company continuing to acquire other businesses. In our view, the risks that Ducommun overpays for future acquisitions or is not able to integrate it properly outweigh the potential rewards. We decided to take profits on Ducommun despite its P/E of 18 being much lower than Barrett’s P/E of 33.
How Expensive is Your Asset Class? Look Beyond The Index
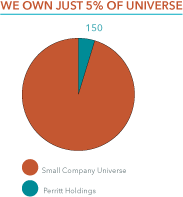
The micro-cap asset class is vast. Our investable universe includes approximately 3,000 companies with valuations and characteristics that vary widely. Generally, we own 100-150 names, about 5% of the universe. With so many options to choose from, the characteristics of our portfolio are not dependent on the average valuations of the index. There are hundreds of small companies with P/E ratios below 10. Conversely, many more can be found with P/E’s above 40. The fact that the P/E of the Russell Microcap Index is 19 actually tells us very little about individual buying opportunities.
Compare this to large-cap investing. Today the P/E of the S&P 500 is 20. With so many eyes on each of the 500 companies there is little room for inefficiencies. And with only 500 names to choose from, the index’s P/E of 20 is more truly reflective of the investable universe.
Next month we will be finishing a new research paper, The Skewed Distribution of Micro-cap Index Valuations, that looks to show how an accurate assessment of valuation for the micro-cap asset class requires a deeper analysis of the index. We take a look under the hood of the microcap index to show the distribution of companies by P/E ratios across the index. Readers will find that, like most things microcap, there is much more to the index than can be neatly summarized in one number.
Click here for standardized fund performance.
Performance data quoted represents past performance; past performance does not guarantee future results. The investment return and principal value of an investment will fluctuate so that an investor’s shares, when redeemed, may be worth more or less than their original cost. Current performance of the fund may be lower or higher than the performance quoted. Performance data current to the most recent month end may be obtained by calling 1-800-331-8936. The funds impose a 2% redemption fee for shares held less than 90 days. Performance data quoted does not reflect the redemption fee. If reflected, total return would be reduced.
MicroCap Opportunities Fund (PRCGX)
-
- The MicroCap Opportunities Fund gained 9.26% in the third quarter, and has now outperformed the Russell 2000 Index on a year to date basis while trailing the Russell MicroCap Index as of 9/30/13.
- Fund attribution often shows the 80/20 rule, where 20% of holdings provide 80% of returns. This year/quarter has been no different. Seven holdings are up 100% or more this year, and several of those drove performance in the quarter, including Addus (ADUS), Bank of the Internet (BOFI) and Century Casinos (CNTY).
- Stock selection was most pronounced in the Financials and Consumer Discretionary sectors. Stock selection in Financials added 1.80% versus the Russell 2000 Index and 1.71% versus the Russell MicroCap Index. Strong selection in the Financial sector more than made up for a relative under weight versus the index, which detracted from performance.
- Although portfolio returns in the technology sector were positive, stock selection detracted from relative performance. The portfolio return of technology names was 6.66% in the quarter vs. 14.21% for the Russell 2000 Index and 12.45% for the Russell Microcap Index.
Ultra MicroCap Fund (PREOX)
-
-
- The Ultra MicroCap Fund gained 12.81% in the third quarter, versus 11.62% for the Russell Micro Cap Index.
- We always stress the difficulty of comparing this fund to a benchmark as it invests in companies far below the traditional radar, as demonstrated by its average market capitalization of just $65 Million (the lowest of all 7.983 equity Funds, according to Morningstar as of 9/30/13).
- The fund has tended to behave differently than the markets this year and this quarter. Because they are not widely followed, many holdings have not reacted with the market on negative days, helping performance (as seen in the beta vs. the Russell microcap of 0.70 & r-squared of 0.77). It conversely has tended to lag on large positive days.
- Overall stock selection was strong, contributing 2.87% to relative performance. The largest gains were in Financials, which accounted for 2.50%. We are largely underweight Financials although the names we do hold performed well.
- Cash was a small drag on performance, detracting 0.74% vs. the benchmark. We have experienced positive flows, and there were also a few buy-outs near the end of the quarter that increased cash level.
-
Distribution
Due to recent gains, both Funds will pay a distribution in 2013. We expect to distribute only Long-Term Gains Record Date= 11/19/13 Ex-Date 11/20/13