Manager Commentary-Archive
Manager Commentary, 3rd Quarter 2016
“YOU CAN’T ALWAYS GET WHAT YOU WANT”
Low cost passively managed funds have been all the rage for investors in the past few years. According to Morningstar, investors have pumped $437 billion into passively managed funds in the past twelve months while yanking $303 billion from actively managed funds. Given recent rule changes, this interest in passive funds could grow further. The Department of Labor (DOL) earlier this year introduced a new Fiduciary rule, set to take effect in April 2017, which holds individual advisors who work with tax-advantaged retirement accounts to a fiduciary standard, meaning they must work in the best interest of clients. At the top of advisor’s and investor’s minds is cost, which can lead them to passively managed funds. Morningstar also recently said the new Fiduciary Rule by the DOL could attract as much as another $1 trillion into passive funds.
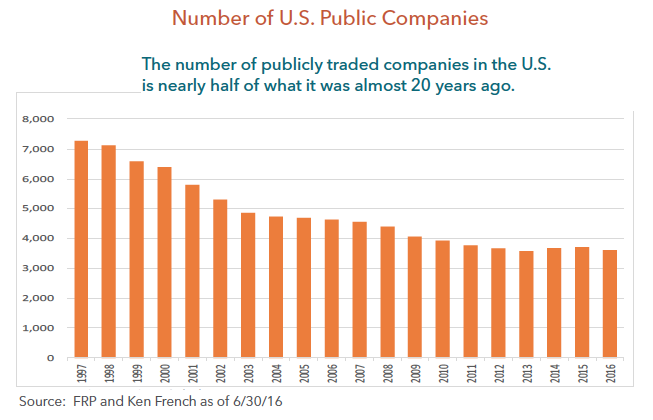
Before you go out and join the others in buying passive funds, we believe it is important to understand history and the details of the indexes used to create these passive funds. The number of publicly traded companies in these indexes has declined dramatically in the past 20 years, which we believe has huge implications for passive investors. As you can see from the chart above, the number of U.S. companies listed on the major exchanges has declined from more than 7,000 to less than 3,600 today. We think it is quite ironic that the Wilshire 5000 Index only has 3,600 U.S. companies in the index.
There are several reasons for the decline in public companies, but many are related to the lack of IPOs and the regular occurrence of mergers and acquisitions. We would argue that quality companies are routinely acquired, therefore there are less public companies which reduces the quality of the indexes. In fact, one of the most important factors we use to judge company quality is profitability.
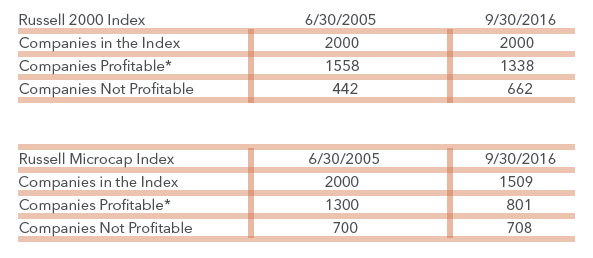
The table below details some interesting history for the Russell 2000 Index and the Russell Microcap Index. As you can see, the number of profitable companies has declined significantly in the past 10 years while the number of unprofitable companies has increased significantly. In fact, the Russell Microcap Index has lost nearly 500 profitable companies during the past 10 years, and the percent of profitable companies in the Index is only a little more than 50%. In addition, nearly 150 of those 500 companies were only recently removed from the Index, and the majority of those were related to buyouts. It is important to note that this is a record high of unprofitable companies for the Russell Microcap Index and a non-recessionary high for the Russell 2000 Index. We believe these statistics increase the attractiveness of active management within the small/micro-cap marketplace.
As I mentioned earlier, investors are flocking to passively managed funds, which include products that mirror the Russell 2000 Index and the Russell Microcap Index. In the past 10 years or so, we have seen assets invested in these vehicles grow from less than $1 billion to tens of billions. For example, iShare offers IWM, which is an ETF tracking the Russell 2000 Index. This passive fund has grown from less than $1 billion in assets a little more than 10 years ago to nearly $30 billion today, and this is only one of several passive funds in the small-cap space.
The bottom line is that we believe investors want a low cost diversified portfolio of high quality stocks, but you can’t always get what you want. We believe if investors are willing to pay a little more for the skill of an active manager, they can get what they need.
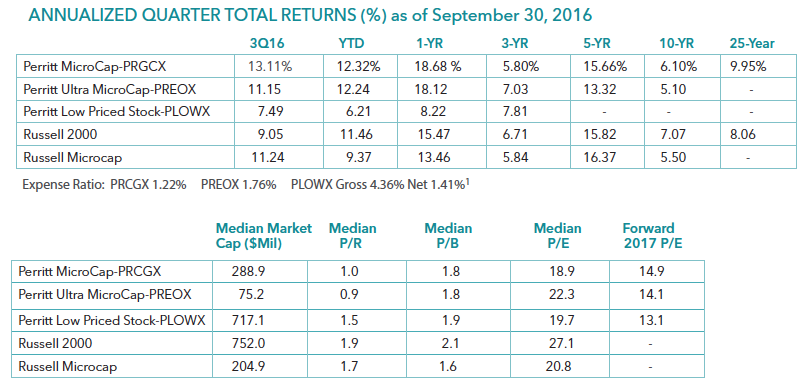
PERFORMANCE AND VALUATION UPDATE
Performance data quoted represents past performance; past performance does not guarantee future results. The investment return and principal value of an investment will fluctuate so that an investor’s shares, when redeemed, may be worth more or less than their original cost. Current performance of the fund may be lower or higher than the performance quoted. Performance data current to the most recent month end may be obtained by calling 800-331-8936. The funds impose a 2% exchange and redemption fee for shares held 90 days or less. Performance data quoted does not reflect the redemption or exchange fee. If reflected, total return would be reduced.
Performance data quoted of the Low Priced Stock Fund for periods on or prior to 2/28/14 represents past performance of the fund’s predecessor, a separately managed account. The fund is the successor to a separately managed account. The investment policies, objectives, guidelines and restrictions of the fund are in all material respects equivalent to those of the predecessor, and the predecessor’s portfolio managers are the current portfolio managers of the fund. However, the predecessor was not a registered investment company. Had the predecessor been registered under the Investment Company Act and been subject to the provisions of the Investment Company Act and the Internal Revenue Code to which the fund is subject, its investment performance may have been adversely affected. The performance information reflects the gross expenses of the predecessor adjusted to reflect the higher fees and expenses of the fund. The performance is shown net of the annual management fee of 1.00% and other expenses. The performance was achieved by the predecessor when assets were relatively small; the same strategies may not be available, and similar performance may not be achieved, when the fund’s assets are larger.
The MicroCap Opportunities Fund is a successor to the investment performance of the Perritt MicroCap Opportunities Fund, the Fund’s predecessor. Performance information shown for periods on or prior to March 31, 2014 is that of the fund’s predecessor. The MicroCap Opportunities Fund was advised by the same adviser, has the same investment objective and strategies as the predecessor fund.
1The investment adviser has voluntarily agreed to waive fees and/or reimburse operating expenses (other than interest, brokerage commissions, dividend expense on short sales, taxes, extraordinary expenses and acquired fund fees and expenses) through 2/28/2017.
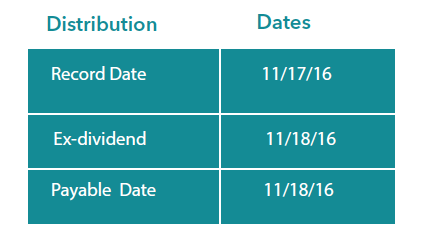
DISTRIBUTION UPDATE
The Perritt MicroCap Opportunities Fund and the Perritt Ultra MicroCap Fund paid distributions on 11/18/2016 to shareholders of record on 11/17/2016.
- The Long-Term Capital Gain distribution in the Perritt MicroCap Opportunities Fund (PRCGX) was $3.26969 per share and $0.71032 per share in the Perritt Ultra MicroCap Fund (PREOX).
- The Short-Term Capital Gain distribution in the Perritt MicroCap Opportunities Fund (PRCGX) was $0.02051 per share and $0.02136 per share in the Perritt Ultra MicroCap Fund (PREOX).
- The Perritt Low Priced Stock Fund (PLOWX) paid no distributions.