

Manager Commentary-Archive
Manager Commentary, 2nd Quarter 2014
The Greatest Story Never Told
Examining the ‘Stealth Bear Market’ within Small Company Indexes
Small and large company equity performance has continued to diverge in the first half of 2014. Small companies significantly outperformed large-cap equities in 2013. This year we have seen a reversal, as smaller company equities have lagged large-cap stocks through June 30. Recent trends have led to sweeping claims that small-cap valuations have become “stretched.” Is this true? This quarter we will attempt to show how investors can determine the answer for themselves by digging through the actual companies listed in the indexes.
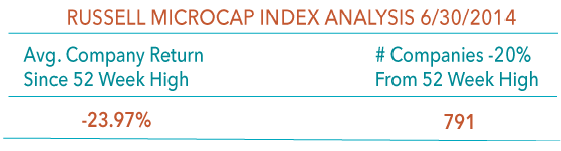
The stock market is not a market of indexes, it is a market of companies. When you actually examine the individual names that form the small company indexes, what we see is that we have experienced a “stealth bear market” in smaller company stocks: the average stock in the Russell Microcap Index has fallen -23.97% from its 52-week high. Significant declines are broad-based, as 791 companies have fallen 20% or more from their 52-week high. What this means is that while certain small/micro-cap industries or individual companies are indeed expensive (in our view), there are certainly pockets of opportunity to be found.
Past performance does not guarantee future results.
Small company indexes are at or near all-time highs, yet the majority of individual names have fallen 20% below their 52-week high. How can we explain this condition? Performance analysis shows that Index returns are being driven by a smaller number of high-flying biotech and internet software stocks. As fundamental, value-oriented managers, we believe these investments carry significant risk. names such as Open Table (OPEN), Yelp (YELP), and Zillow (Z) may benefit from consumer recognition and investor excitement, but their current market valuations may not be justified in the future.. We believe that true small company opportunities – names with strong potential earnings power and valuations that aren’t “stretched” but “compressed” – lie elsewhere.
Past performance does not guarantee future results.
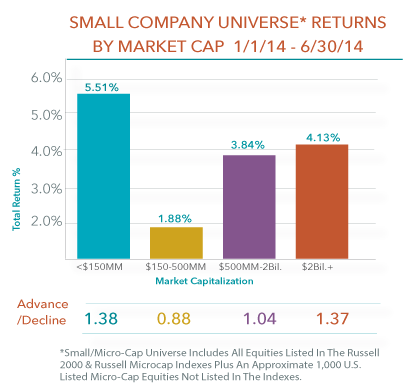
Performance within the small cap universe has also diverged in the first half of 2014, as seen in our table above. Excluding the group of companies with a market capt under $150 million (which includes many penny stocks susceptible to volatile performance swings), the larger the company the greater the return. Investors can sketch a rough chart ranking 2014 performance by asset class and see a linear climb: large-caps performed best, followed by mid-cap, then small-cap, and finally within small-cap where the smaller companies have the least return.*
We hesitate to draw and conclusions about such short term returns signifying a new trend. It is possible that this is the start of a period of large-cap outperformance. Equally likely is that we are seeing a natural reversion following 2013’s significant outperformance by smaller companies, and we are still in a market where smaller companies are in favor. What does appear material to us is the decreasing level of correlation between the large- and small/micro-cap asset classes.
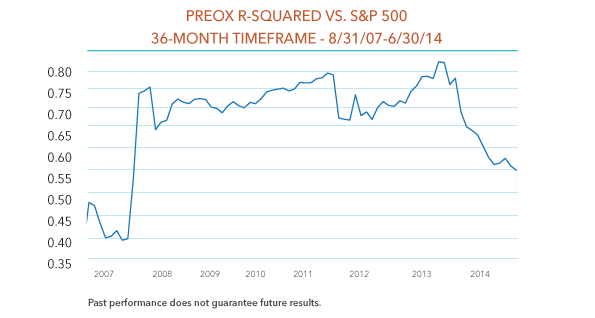
Low correlation is one of the key reasons why we believe so passionately that investors should allocate to micro-cap equity. According to Ibbotson & Associates**, between 1926 and 2013 smaller company returns have had a correlation of 0.80 to larger company returns. Micro-cap returns should provide investors with even lower correlation than small companies, as micro-cap companies are generally far off the radar screens of traditional Wall Street analysts. Following the financial crisis, returns of all asset classes, including micro-cap equity, began moving in sync and correlation increased. As seen below, over the past year and a half this trend has started to reverse. The r-squared of the Perritt Ultra MicroCap Fund, having tracked generally near 0.75 for the past five years, has begun to decline to pre-2008 levels.
The effect of lower correlation on investor portfolios can be significant. As we will outline in an upcoming research paper, Adding Micro-cap to Small-cap, our research shows that complementing your small-cap allocation with an investment in micro-cap has lowered correlation and has helped reduce volatility. Part of the reason that this benefit has proved possible is the lower correlation historically delivered by an investment in micro-cap.
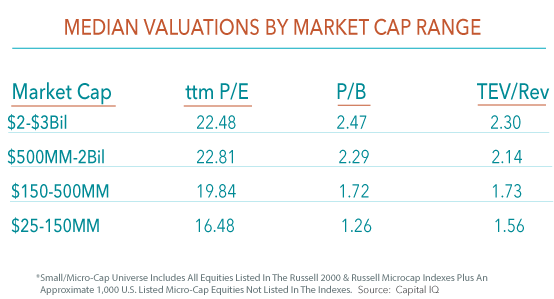
Dig through the individual names in an index and you can see widely varying returns and valuation characteristics. Our final chart below compares valuation metrics according to company size within the small company universe. As can be seen, the smaller the company, the lower the valuation. This holds true for P/E, P/B and Total Enterprise Value/Revenue (TEV/Rev).
Perhaps we have been in this business for too long, but the below chart made us reflect on the “good old days” of the 1970’s and 80’s, when growing small companies were rewarded with higher valuation multiples. In the era when our firm was founded, investors paid a premium to own fast-growing, dynamic small companies. Today, it seems normal for large, consumer staple-type companies to be rewarded with lofty multiples, despite internal growth rates of just a few percentage points per year. Conversely, many small companies growing at 15-20% per year are valued at a discounted multiple. Perhaps this is another example of the famous “new normal,” but it seems backwards in our view.
Click here for standardized fund performance.
Performance data quoted represents past performance; past performance does not guarantee future results. The investment return and principal value of an investment will fluctuate so that an investor’s shares, when redeemed, may be worth more or less than their original cost. Current performance of the fund may be lower or higher than the performance quoted. Performance data current to the most recent month end may be obtained by calling (800) 331-8936. The funds impose a 2% exchange and redemption fee for shares held 90 days or less. Performance data quoted does not reflect the redemption or exchange fee. If reflected, total return would be reduced.